


What is a Smith Chart?
February 10, 2023Introduction
The Smith chart is a useful graphical tool to convert between impedances and reflection coefficients. It may also be used to solve impedance-matching problems. It can be thought of as a polar reflection coefficient chart with overlaid impedance curves.

Figure 1 – Smith Chart
Reflection Coefficients
The reflection coefficient of an impedance can be measured with a vector network analyzer.
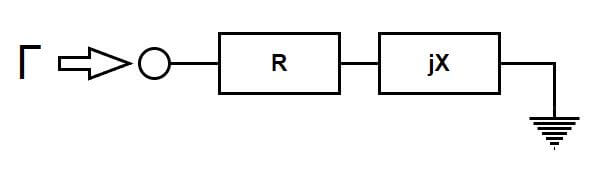
Figure 2 – Measured Reflection Coefficient
That reflection coefficient will be: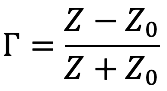
where Z is the complex impedance R+jX and Z0 is the characteristic impedance of the source.
For Z = Z0, the reflection has a magnitude of zero, a dot at the center of the smith chart. For Z = 0, the reflection is 1∠0 or Cartesian 1,0.
For Z = ∞, the reflection is 1∠180 or Cartesian -1,0.
For Z = 23+j75, the reflection coefficient is 0.762∠64 or 0.333+j0.685
These four reflections are plotted on the polar plot in Figure 3.
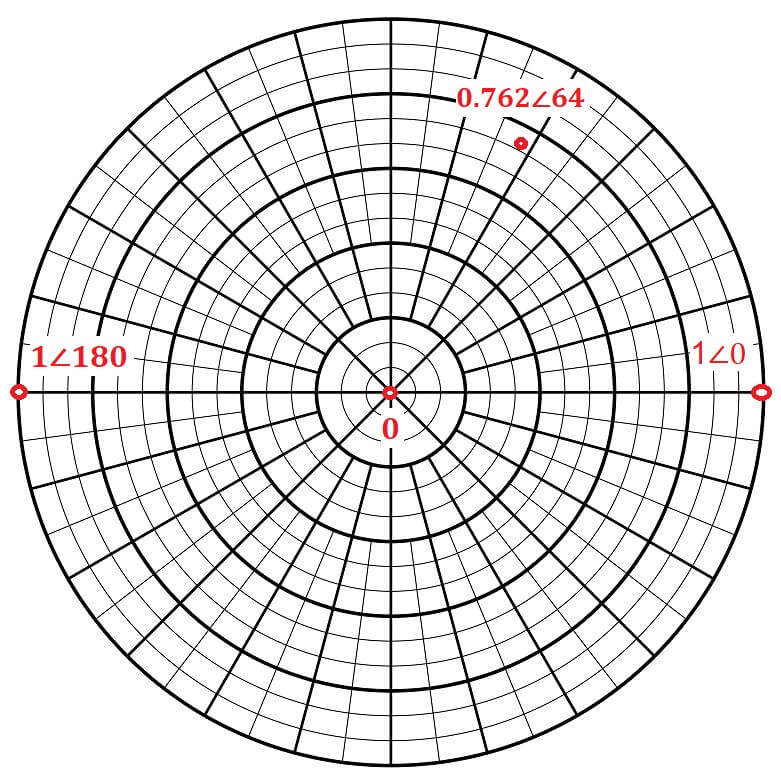
Figure 3 – Polar Reflection Coefficients
Building the Smith Chart
These reflection coefficients were calculated from Equation 1. Using this equation, we could choose a real part of the impedance, the resistance, hold it constant, and then let the imaginary part, the reactance, go from -∞ to +∞ and draw the result on the polar plot.
With the resistances normalized to 50 ohms, we can draw these circles of constant resistance for 10, 20, 50, 100, and 200 ohms, or 0.2, 0.4, 1, 2, and 4 when normalized.
Figure 4 – Polar Chart with Resistance Circles
The circles are centered at R/(R+1),0, with a radius of 1/(R+1), where R is the normalized value.
We can then choose reactances and sweep the resistance from -∞ to +∞ to obtain arcs of constant reactance.
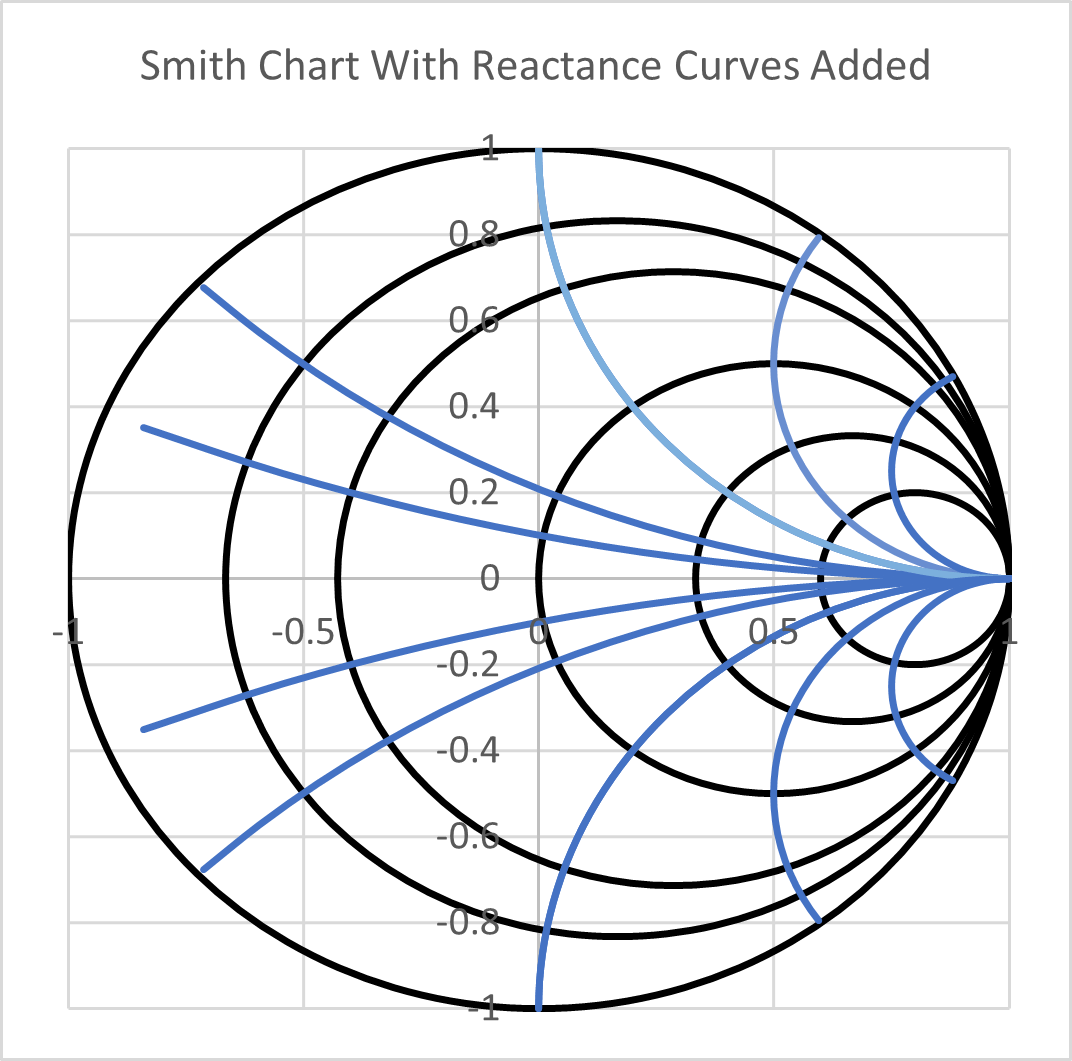
Figure 5 – Completed Smith Chart
After the circles of resistance and curves of reactance are added to the polar chart and labeled, one can locate the reflection coefficient of any impedance by inspection.
Impedance Matching
You can use a Smith chart to assist in impedance matching with lumped elements or transmission lines. For instance, if we start at an impedance of 20+j35Ω and want to match to 50Ω at 500 MHz, we can use a shunt capacitor followed by a series capacitor. To make the graphical method simpler, a mirror image of the resistance and reactance circles and arcs must be added (in blue in Figure 6) to represent shunt conductance and susceptance.
The first step is to add a shunt term to provide enough susceptance to get to the constant 50Ω resistance circle. To get from 20+j35 to the constant 50 ohm resistance circle, we added 11.9 *10-3 mhos of capacitive susceptance, or 3.8 pF at 500 MHz. From there, a negative reactance of 39.8 ohms is needed to get to the center of the Smith chart, or 8.0 pF at 500 MHz. These manipulations can be done directly on a Smith chart, but it is much simpler to use the Smith program designed by Prof. Fritz Dellsperger at www.fritz.dellsperger.net. The demo version is free of charge, while the licensed version has more features. It is very instructive to see how the addition of series or shunt elements moves the chart’s impedance.
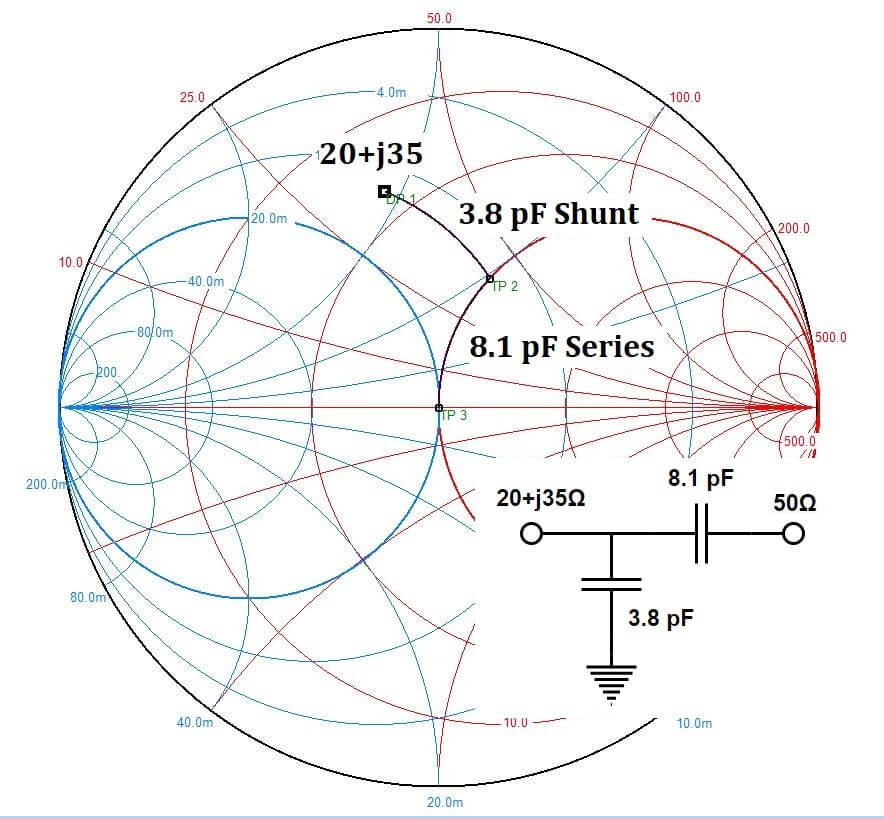
Figure 6 – Matching
This same match could be accomplished with a series capacitor to get to the 0.02 m-mho conductance circle (1/50Ω), followed by a shunt capacitor to get to the middle of the Smith chart. 30.1 pF and 7.8 pF respectively, as in Figure 7.
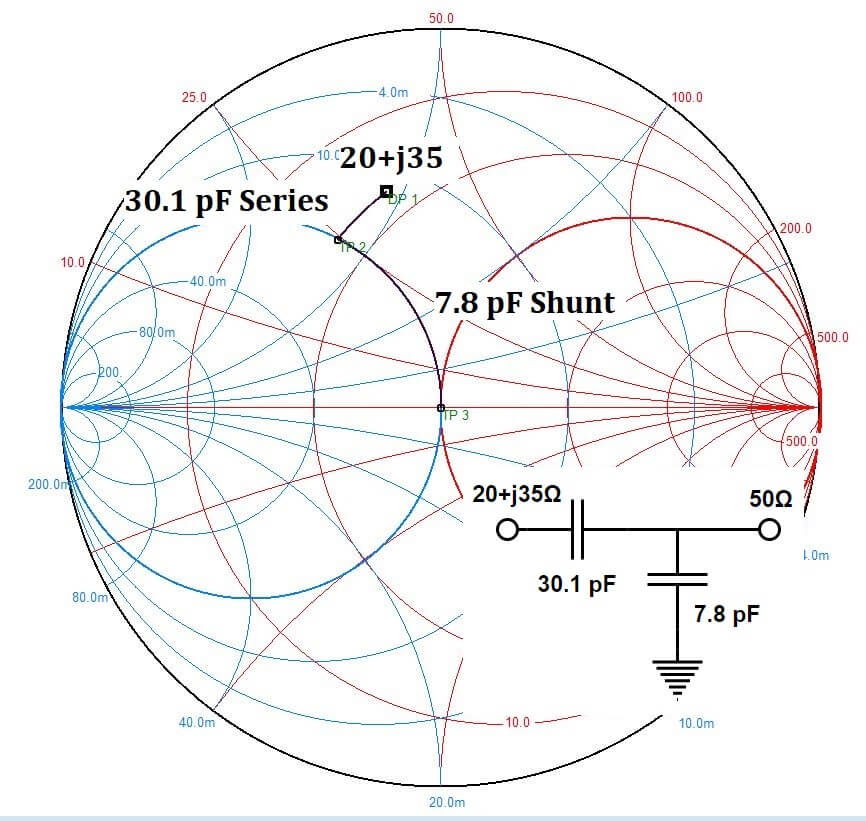
Figure 7 – Alternate Match
Finally, you could use a 5.3 pF series capacitor to get to the 0.02 m-mho (1/50Ω) conductance circle on the other side, and then use a shunt 13 nH inductor, as in Figure 8, to get to the middle of the Smith Chart. The possibilities are endless, but the matching bandwidth will become narrower and narrower as more distance is traversed on the chart.
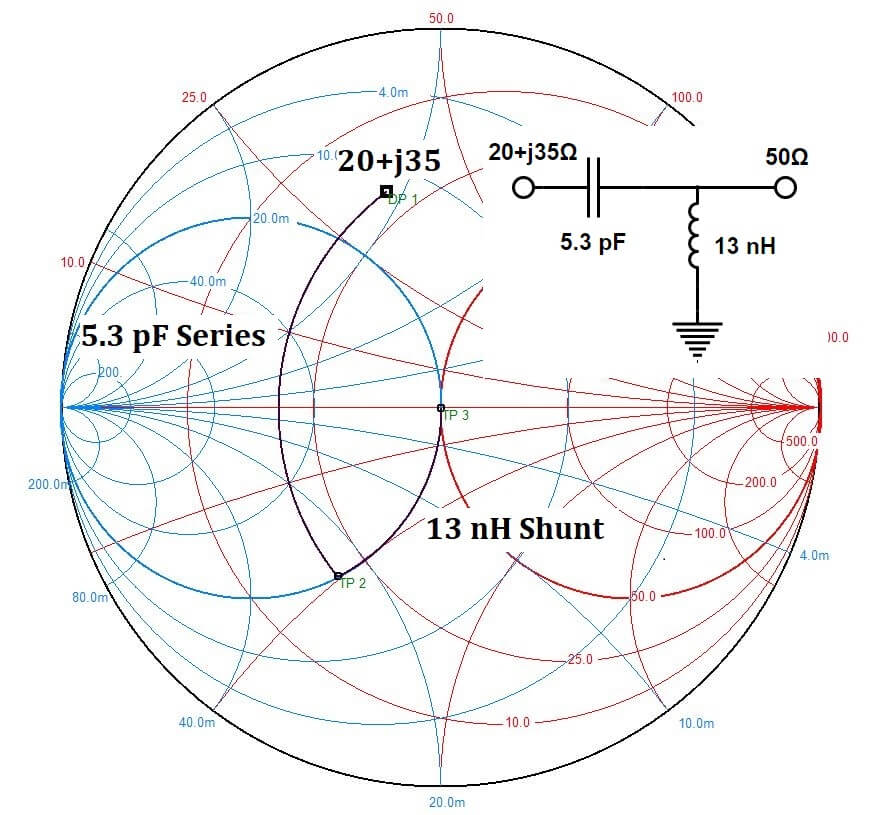
Figure 8 – LC Match
Transmission Line Matching
Transmission lines can also be used for impedance matching. In a special case, if it is necessary to match from one real impedance to another, such as 50Ω to 100Ω, a quarter wavelength transmission line with impedance of the square root of the product of the two, or 70.7Ω will work.
![]()
Figure 9 – Series Transmission Line Match
A Wilkinson power splitter is comprised of two, quarter wavelength 70.7Ω transmission lines, which are joined together at one end. Each 50Ω terminated line looks like 100Ω where they are joined together, resulting in an effective 50Ω impedance.
In general, a series transmission line will rotate any real impedance Z clockwise around impedance and a 50Ω transmission line will rotate an impedance around the center of the Smith chart.
For a large change in impedance, such as from 50Ω to a 2Ω LDMOS power amplifier gate, make the transition in two or more steps to maximize the match bandwidth. A quarter wavelength 6Ω line, followed by a quarter wavelength 30Ω line, is preferrable to a single quarter wavelength 10Ω line. The bandwidth is superior, as shown in Figure 11.
![]()
Figure 10 – Transmission Line Match
![]()
Summary
The Smith chart is a very convenient tool to graphically calculate and visualize impedance transformations with lumped elements or transmission lines. There are many lumped element solutions for any given matching problem, and transmission lines—particularly quarter wavelength lines— may be used singly or in cascade to match two real impedances.
The chart is educational and helps provide an intuitive understanding of impedance transformations.