mmWave Mixer Measurements with a Low Frequency VNA
April 25, 2022Introduction
It is important to use the right equipment for the right measurement to get results that are accurate. Precision millimeter-wave (mmWave) measurements normally require a VNA with built-in capability or mmWave extenders to augment the frequency range. This equipment may be used to evaluate mmWave mixers which are commonly used to up-convert or down-convert 5G signals back and forth from baseband frequencies.

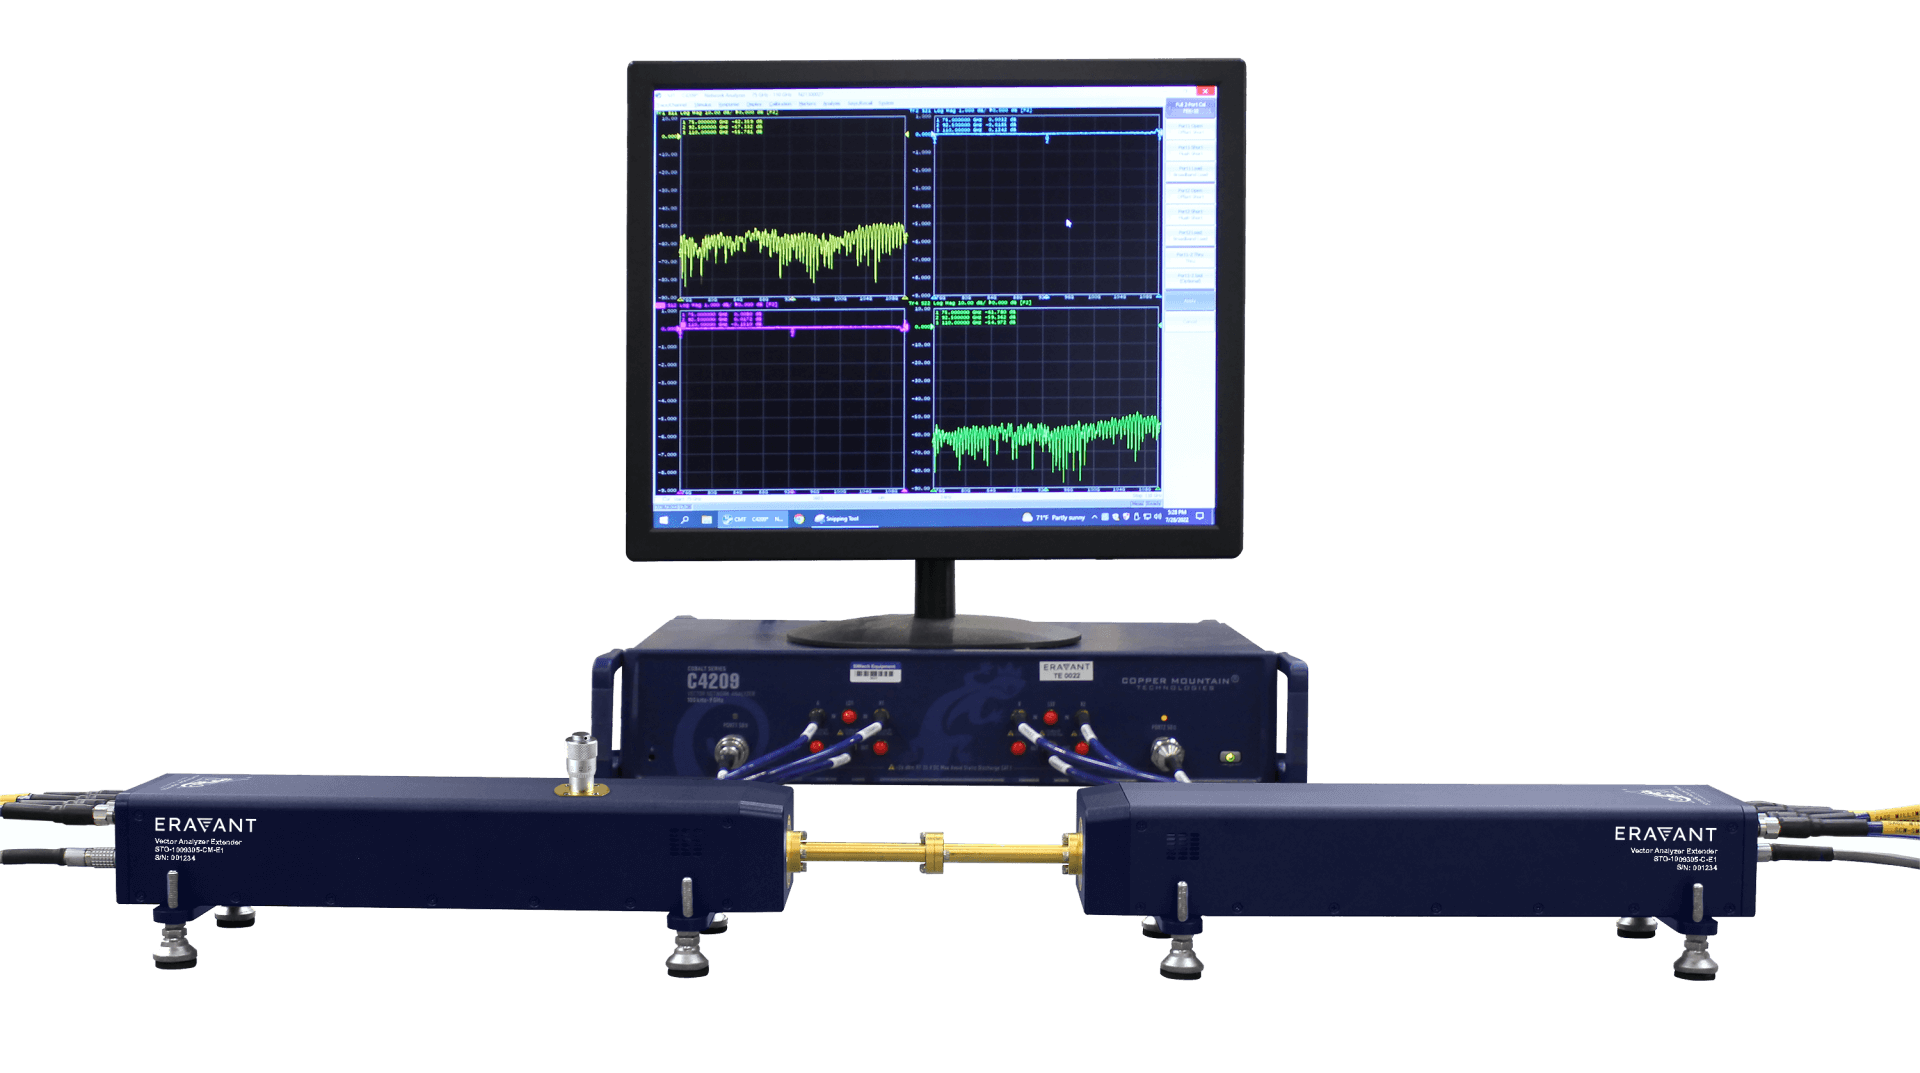
Figure 1 – CobaltFx mmWave measurement system
CMT mmWave frequency extension systems presently support the measurement of frequencies up to 330 GHz in specified bands which are primarily determined by the type of waveguide required. These extenders and bands are:
FET-1854: 18-54 GHz FET-WR15: 50-75 GHz FET-12: 60-90 GHz FET-10: 75-110 GHz
WR8: 90-140 GHz WR6.5: 110-170 GHz WR5.1: 140-220 GHz WR4.3: 170-260 GHz
WR3.4: 220-330 GHz
The CobaltFx mmWave frequency extenders operate in conjunction with a Copper Mountain Technologies 9 or 20 GHz Cobalt series VNA.
Using a Low Frequency VNA to measure a mm-Wave Mixer
It’s also possible to analyze the performance of a mmWave mixer using a low frequency VNA. Because the baseband IF frequency is often in range for a microwave frequency VNA, a “Reference” mixer can operate with the same Local Oscillator (LO) to generate the mmWave signal needed to analyze a Mixer Under Test (MUT). See the diagram below.

Figure 2 – Vector Mixer Calibration Diagram
In this diagram, the VNA is connected to the Reference Mixer and the MUT. The “RF” in this example is the low frequency to and from the VNA and the “IF” is the mmWave signal. This nomenclature could certainly be interchanged. The Reference Mixer is needed to up-convert and down-convert between the mmWave and the VNA baseband frequencies. To do this accurately, a first level of calibration is performed before the two mixers and a second-tier calibration is performed after the image filter to de-embed the effect of the Reference Mixer. With both calibrations in place, it is possible to measure the performance of the Mixer Under Test alone and determine its return loss on both ports and conversion loss from RF to IF ports. But how is this second-tier calibration performed?
First-tier calibration is performed between the two points shown in Figure 2. That is, the two points labeled “First Tier Calibration” were detached from the mixers and had Open, Short and Load applied and then were again connected with a thru to perform a full 2-port calibration between these two points.
For the second-tier calibration, the reference mixer and image filter are attached to the Port 1 cable and the local oscillator is applied to it. The Vector Mixer Calibration is then begun in the appropriate section of the calibration menu on the VNA. A mmWave calibration kit which will be used on the mmWave side of the mixer is first selected, then the port connection, which will be Port 1 in this case. The LO frequency is entered along with the selection of IF mixing strategy, “RF+LO”, “RF-LO”, or “LO-RF”. This information is necessary to allow the VNA to calculate the mmWave IF frequencies from the VNA output frequencies that the calibration kit sees. This is important for calibration since the Open and Short will have a different reflection phase at each mm-Wave frequency.
The mmWave Open, Short, and Load will then be applied to the high-frequency side of the mixer in turn and if the “Setup Option” box is checked in the software, a full 2-port Touchstone characterization of the Reference Mixer will be loaded into Port 1 de-embedding and the de-embedding function enabled automatically. The Reference mixer has now been effectively removed from the measurement and one can proceed to measure the MUT.
Creating the de-embedding data
But wait! Where did the 2-port characterization of the Reference Mixer come from? We only performed a 1-port calibration on the mmWave side. We never did anything like a “Thru” measurement. To determine the full 2-port response of the mixer, we take advantage of a mathematical trick. Figure 3 shows the input reflection coefficient, ![]() of any S-Parameter network terminated with a known load,
of any S-Parameter network terminated with a known load, ![]() .
.

Figure 3 – Terminated S-Parameter Network
It can be shown that the input reflection for the network above is given by:
![]() (Eq 1)
(Eq 1)
If we assume transmission reciprocity through the reference mixer such that S12 = S21, then we can eliminate S12 in the above equation and write Equation 2.
![]() (Eq 2)
(Eq 2)
This is a reasonable assumption for an essentially passive circuit. If we apply three known loads to the network and can measure the input reflection coefficient for each, then we will have three equations and three unknowns and can solve for S11, S21, and S22 at each VNA frequency.
This is done in the Vector Mixer Calibration process. A full 2-port Touchstone file is calculated and used to de-embed the Reference Mixer. It is worth noting that the generated file is not exactly a normal Touchstone file. It works quite well for the purposes of de-embedding, but the frequencies in the file are the input frequencies from the VNA which indirectly correspond to mmWave output frequencies from the mixer. You can’t normally have Touchstone file entries that correspond to a response going from one frequency to another.
Measurement Example
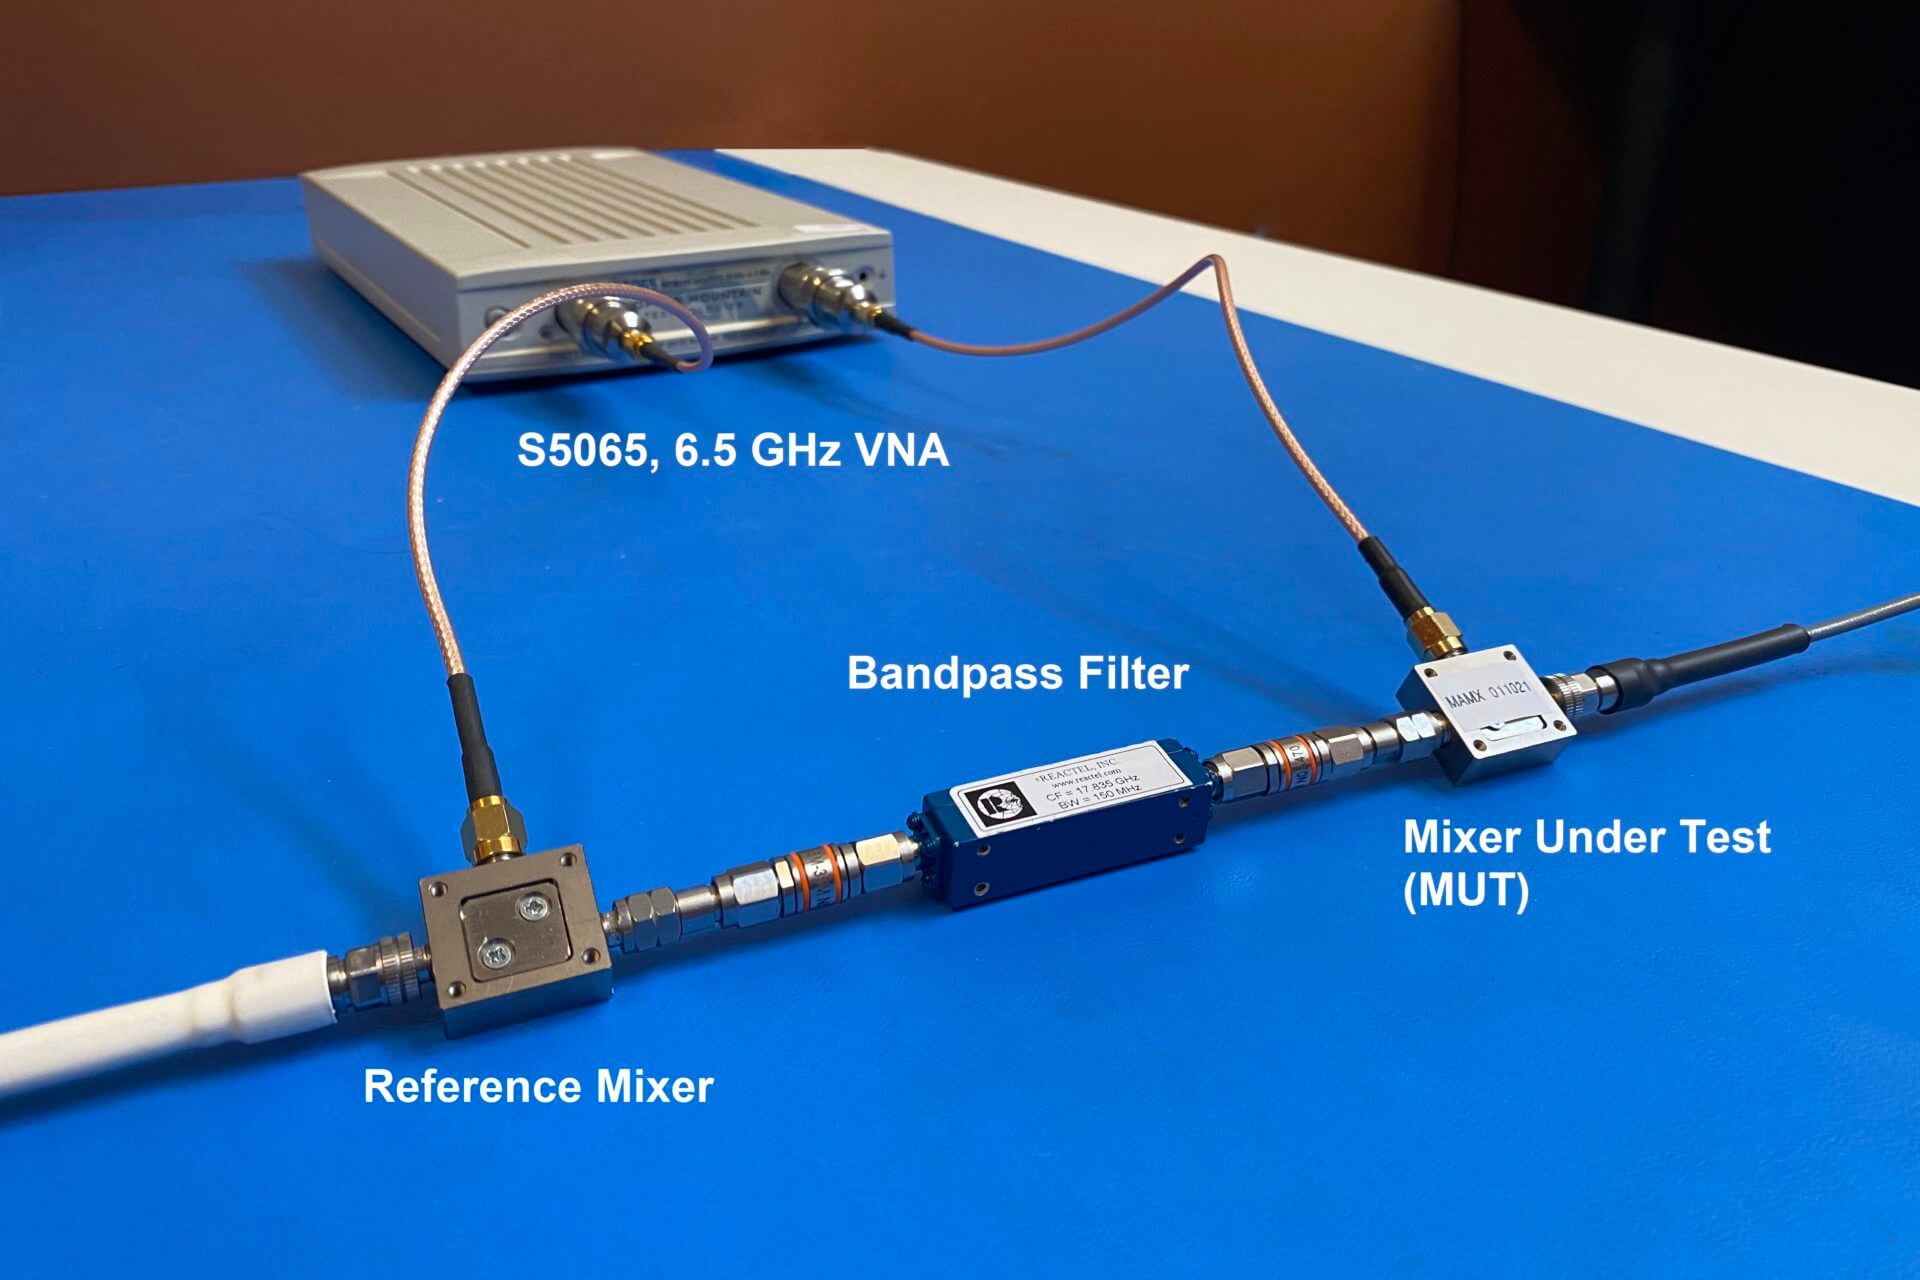
In the following example, the conversion loss of a Macom MAMX-011021 35 GHz mixer will be measured. To accomplish this, a Marki ML1-1850 50 GHz mixer will be used for the upconverting reference mixer. The reference mixer will be attached to Port 1 and followed by a 17.835 GHz, 150 MHz wide bandpass filter. With a 20 GHz Local Oscillator (LO) input, the IF output will be 17.835 GHz +/- 75 MHz with an RF input from the VNA of 2.165 GHz +/- 75 MHz. The IF will be created from LO-RF and the LO+RF image signal at 22.165 GHz +/- 75 MHz will be eliminated by the bandpass filter.
It is important to eliminate the IF image signal as it would recombine in the MUT to generate the same RF frequency as the desired IF signal. Since the image does not arrive at the MUT with the same phase, the generated RF would suffer constructive and destructive interference with the desired IF signal causing undesirable ripples. Figure 4 shows the test setup with the frequencies noted.

Figure 4 – Mixer Test Diagram
A full 2-port calibration was first performed on the ends of the test cables with the VNA frequency at 2.165 GHz center and 150 MHz span using an Automatic Calibration Module, or ACM. Next, the Z5411* 50 GHz mechanical calibration kit was selected and the LO frequency and IF scheme were set up in the Vector Mixer Calibration as shown:

Figure 5 – Vector Mixer Calibration Menu
After the Open, Short, and Load on the Z5411 calibration kit were measured, the VNA automatically created the Touchstone de-embedding file and applied it to Port 1, effectively removing the conversion loss effects of the Reference mixer and the insertion loss of the image filter. The MUT was then attached, and a measurement performed. The results are shown in Figure 7. The measured conversion loss compares reasonably well with the 8 dB typical performance on the manufacturer’s datasheet.

Figure 6 – Mixer Test Setup

Figure 7 – Conversion Loss of MUT
What about the accuracy?
What sort of accuracy should we expect from this measurement? Examining the de-embedding file is instructive. The calculated S21 of the Reference Mixer is shown in Figure 8:

Figure 8 – De-Embedding S21
Apparently, the loss through the Reference Mixer and Image Filter together is about 10 dB, so the three reflection measurements that were made suffered 20 dB, two-way loss. If we examine Equation 2, the ![]() term in the numerator is this 20 dB loss.
term in the numerator is this 20 dB loss.
When we measured the Reference mixer with the calibration kit Load on its IF port, we explicitly measured S11 since the second term in Equation 2 is equal to zero. That measurement of S11 (approx. -7 dB) is shown below in Figure 9:

Figure 9 – Measured S11
When the Open and Short are applied to the IF of the mixer, the fraction after S11 in Equation 2 is not zero and causes a small vector perturbation on S11. The VNA measurement uncertainty on reflection measurements at -7 dB is +/- 0.4 dB (between 0 and -15 dB) so the vector contribution of the second term of Equation 2 will need to be significantly bigger than 0.4 dB for it to be resolved with reasonable accuracy.
+/- 0.4 dB on -7 dB is approximately +/- 0.02 in linear terms and if we assume that S22 is small in the denominator of Equation 2 we can approximate the contribution of that second term as simply ![]() . If = 0.02 then = 0.141 or -16.9 dB. If the conversion loss of the Reference Mixer is 16.9 dB, the second term of Equation 2 will be approximately 0.4 dB of the value, which is right at the limit of our measurement resolution. This is therefore the hard upper limit for conversion loss of the reference mixer where we can expect to achieve a reasonable calibration.
. If = 0.02 then = 0.141 or -16.9 dB. If the conversion loss of the Reference Mixer is 16.9 dB, the second term of Equation 2 will be approximately 0.4 dB of the value, which is right at the limit of our measurement resolution. This is therefore the hard upper limit for conversion loss of the reference mixer where we can expect to achieve a reasonable calibration.
In this case, the value of is -10.9 dB or 0.285 in linear terms. Squaring this we get 0.081 so our expected error is:
![]()
A Chart of the error expectation on S21 vs S21 value with S11 still equal to -7 dB is shown below in Figure 10:

Figure 10 – Error on S21 vs S21
At 16.9 dB, the error is infinite, and the de-embedding terms cannot be determined with any accuracy at all. It is naturally assumed that any error in the estimation of Reference Mixer de-embedding term S21 (Conversion Loss) will directly impact the measurement error of the DUT.
In this example, -7 dB was used for the value of S11, but over the range of -5 dB to -20 dB the hard limit on accuracy is between -16 and -19 dB and the error curve in Figure 9 is not much changed. Clearly, it is a good idea to use a Reference mixer with 10 dB conversion loss or less or the accuracy of the de-embedding will suffer and the final measurement of the MUT will be unsatisfactory.
Conclusion
Vector Mixer calibration was demonstrated using a 6.5 GHz VNA to evaluate a mmWave mixer. The expectation of error on Conversion Loss measurement of a MUT was approximated from the formula which is used to create the Reference Mixer de-embedding file. It was shown that the conversion loss of the Reference mixer should be 10 dB or less to measure the conversion loss of the MUT with reasonable accuracy and conversion loss above 16 dB or so would give poor results.
*The S5065 VNA originally used in this example has been discontinued. The replacement is the SC5065 VNA, but there are many more models of this type ranging in frequency from 1.3 GHz to 18 GHz.
*The Z5411 Calibration Module originally used for this is discontinued. The replacement calibration kit is the CM24F 50 GHz Calibration Module.


