Choosing the best RF Vector Network Analyzer (VNA) for your application is very important. In an RF Engineering lab, the oscilloscope, the spectrum analyzer, the VNA and the lab power supply are the four main pieces of test gear needed to get the job done. If any one of these is not up to the task, the project will suffer, and deadlines may slip. There are a number of vector network analyzer manufacturers, so let’s discuss how a VNA from Copper Mountain Technologies (CMT) is your best choice.
Let’s start by answering some important questions:
· What is a Vector Network Analyzer?
· What are the components of a VNA?
· How does a Vector Network Analyzer work?
We know that all transmission lines support the transmission of RF signals in both directions. In fact, the stationary solution of Telegrapher’s Equation in the lossless case is:
V1 is the amplitude of the wave moving in the +x direction and V2 the wave moving in the -x direction and k is the wavenumber in radians per unit length of x. Where an oscilloscope measuring the waveform at a spot along the transmission line would depict the sum of the two waves, a VNA can separate them and measure V1 and V2. This unique feature provides extraordinary analytical capability for RF devices.
Figure 1 shows a functional block diagram of a 2-port vector network analyzer. The bridges on Ports 1 and 2 are the devices which separate the forward and reverse waves; those leaving the port and those entering it simultaneously. The forward port is labeled “inc” for incident and the reverse port is labeled “ref” for reflected. This bridge could be a dual directional coupler, or a Wheatstone bridge [1]. The signal amplitude on the two ports is proportional to the forward and reverse signals but attenuated by 20 or 30 dB so as not to steal too much energy. The bridge is the heart of the VNA, that which makes it different from every other type of RF test equipment.
Figure 1 – VNA Functional Block Diagram
A summary of the Vector Network Analyzer working principle is as follows: The RF stimulus source is shown at the top of Figure 1, which can switch back and forth to emit signals from either Port 1 or Port 2. The stimulus frequencies can be quite high in frequency, so a second frequency source, the LO, tracks along with it at a constant offset. Signals from the incident or reflection ports of the two bridges are mixed down with this LO by the four mixers to create a constant Intermediate Frequency (IF). This IF frequency might be somewhere between 1 and 15 MHz depending on VNA model. Higher IF frequencies are required if the VNA supports higher IF bandwidth measurements such as 2 MHz for the CMT Cobalt series. Of course, the higher IF frequency requires a higher speed digitizer (ADC) which increases cost.
The four receivers of a 2-port VNA are conventionally named R1, A, R2, and B. Where R1 and A are from the incident and reflected ports of the Port 1 bridge, respectively, and R2 and B are from the incident and reflected ports of the Port 2 bridge. During any one measurement, only one of the R receivers will be active on the side to which the stimulus is switched. The three active receiver IFs are digitized at a clock rate of 3 or 4 times the IF frequency and the data fed into the DSP block.
Within the DSP block, the digitized receiver signals are mixed down to a zero frequency IF (ZIF) with numerically controlled oscillators (NCOs) and then piped through a set of I and Q Finite Impulse Response (FIR) filters to apply the IF bandwidth chosen by the user in the measurement setup. This usually defaults to 10 kHz but can be as low as 1 Hz and as high as 2 MHz. Low IF bandwidths are used to improve the signal to noise ratio for very low transmission measurements like a 110 dB filter stopband. High IF bandwidths are used when measurement speed must be very fast such as a synchronized S-parameter measurement within a 1 uS RF pulse width.
The data can be heavily decimated after the IF bandwidth has been applied to the receiver data. For instance, a 15 MHz IF might be sampled at a 50 MHz rate, then after applying a 10 kHz IF bandwidth, only one out of a thousand points are kept, and the data rate becomes 50 kHz. The now lower data-rate receiver data is packaged and streamed over the USB bus to the host computer for processing.
Uncalibrated S-parameters are formed from the ratio of receivers to either R1 or R2 depending on which port is sourcing the incident signal. S-parameters are ratioed such that the absolute power of the stimulus signal is irrelevant.
Figure 2 – Incident and Reflected Signals
Figure 2 shows the incident signal leaving the VNA from Port 1 on the left. The exiting signal is measured by the R1 receiver. Some of the incident signal is reflected at the input of the DUT and travels back to Port 1 to be measured by the A receiver. The remainder passes through the DUT and enters Port 2 to be measured by the B receiver. The raw uncalibrated S-parameters are:
Similarly, if the incident signal is emitted by Port 2:
Within the host computer running CMT VNA software S2VNA, calibration is applied to the four S-parameters and they may then be displayed in various formats on the screen.
Because the S-parameters are referenced to stimulus R1 or R2, we obtain the relative phase of A or B to them. S-parameters are complex numbers with a magnitude and phase, and it differentiates the VNA from a scalar network analyzer.
What Can You Do With a VNA?
What is a Vector Network Analyzer used for? A VNA can be used to measure a number of electronic devices, among them filters, amplifiers, transmission lines and antennas. If a filter is connected between the two ports of the VNA, the reflection from the input—the return loss—can be measured. The signal passing through the filter—the insertion loss—can also be measured. Figure 3 shows such a measurement.
Figure 3 – Filter Measurement
A VNA can be used to measure the gain, input return loss, output match, and 1 dB compression point of an amplifier. This kind of measurement is shown in Figure 4 and Figure 5. For bench-top measurement, a Compact VNA from CMT, as shown in Figure 6, would be a great choice. There are models with highest range 1.3 GHz, 4.5 GHz, 6.5 GHz, 9 GHz, 18 GHz.
Figure 4 – Amplifier Measurements
Figure 5 – Amplifier P1dB Measurement
Figure 6 – SC5065, 300 kHz to 6.5 GHz Compact VNA
A VNA can be used to measure antenna performance and their feedlines. The time domain mode can be used to evaluate the characteristic impedance vs distance of a coaxial feedline. This is useful to find cable faults in buried cables or those which feed antennas at the top of a tall tower. The best VNA for these measurements will be small, portable units such as the 6 GHz R60, or the 14 GHz R140B from CMT. Figure 7 shows the R60 1-Port VNA.
Figure 7 – R60, 6 GHz USB Powered 1-Port VNA
For RF Power Amplifier (PA) measurement [4] [5], a Cobalt series VNA with Direct Receiver access would be the best choice. Usually, a PA will need a preamplifier to supply sufficient drive level. A directional coupler can be placed between the preamp and the PA and attached to the VNAs receivers to allow measurement of S11 of the PA.
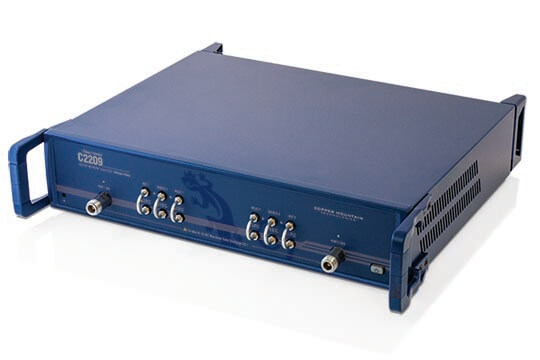
A directional coupler might also be placed on the output of the PA and attached to the Port-2 receivers, so the power into the VNA is reduced by the coupling factor of the coupler. Figure 8 shows a Cobalt VNA from CMT.
Figure 8 – Cobalt C2209, 9 GHz VNA with Direct Receiver Access
How is a VNA Different from Some Other Test Equipment?
Is a spectrum analyzer the same as a network analyzer?
These two pieces of test gear are quite different. [2] So what is the difference between a network analyzer and a spectrum analyzer? The VNA generates a signal and then measures that signal, its reflection from a DUT or the amount that passes through it. A spectrum analyzer on the other hand, is meant to measure external RF signals which are applied to its input. These two tasks require a different design methodology. The spectrum analyzer must display the applied signal and a clean spectrum around it without artifacts or spurious signals (spurs). The displayed spike of the applied signal must be very sharp and without side-lobes, so signals close to it may be distinguished. This requires at least two mixing stages creating at least two IF frequencies to ensure proper filtering and elimination of mixer image responses.
The receiver in the VNA is always tuned to the stimulus signal frequency—unless the user has engaged offset mode—so a single mixing stage and a single IF is feasible as the stimulus will never be at the image frequency and image filtering is not necessary. Additionally, the VNA is designed to make exceptionally fast measurements so the DSP IF filter is not a crisp spike but a more rounded shape with side-lobes. This filter is designed for the lowest delay. The necessarily sharp DSP IF filter in the spectrum analyzer has a significant delay which reduces the sweep time. See Figure 9 and Figure 10 below.
Figure 9 – VNA 1 kHz IF, 100 kHz Span
Figure 10 – Spectrum Analyzer 1 kHz IF and 100 kHz Span
In a pinch, a VNA can be used as a basic spectrum analyzer by turning off the internal stimulus signal and viewing one of the absolute input receivers, A or B—Port 1 or Port 2 input. The IF BW must also be set to greater than (Fstop-Fstart)/(Number of Points) to ensure that no signals are skipped over. If the span is sufficiently wide one will see two spikes, the higher one being the image from the single mixing stage, and they will be offset by 2xIF. If the span is very narrow, the sidelobes of the DSP IF filter become visible. If the choice is between a vector network analyzer vs a spectrum analyzer for doing spectrum analysis, the latter is the best choice.
Impedance Analyzer vs Network Analyzer
An impedance analyzer is designed to measure complex impedances up to perhaps 3 GHz. This can be important for characterizing lumped elements like inductors or capacitors.
Generally, this equipment comes with fixturing for measurement of 0402, 0603 or other standard sized passive components. Calibration or de-embedding of the fixture may be required and there will be provisions to do so.
A VNA can measure impedances with very reasonable accuracy. Impedance conversion is a standard analytical feature in CMT VNAs, and it supports all major measurement configurations. For low impedances, from 2 milli-ohm to 20 ohms, the DUT is measured in configuration 2 in Figure 11 with one leg grounded and the other leg attached to a thru line. S21 is measured and the impedance is calculated from that measurement by the VNA.
For impedances from 20 to 200 ohms, the DUT is measured in configuration 1 with a 1-Port S11 measurement with its other leg grounded. Finally, for 200 ohms to about 1 MOhm, S21 is measured in configuration 3 with the DUT in series. All three configurations are shown in Figure 11. Results are displayed by choosing the appropriate conversion and then setting the display to LinMag. The units on the screen will be in ohms. See [3] for more detail on this.
Set the horizontal axis to Log-Mag for best dynamic range.
Figure 11 – Impedance Measurement with Conversion
What Makes a VNA from CMT the Best Choice?
CMT USB vector network analyzers are designed from the ground up to produce precision measurements at an affordable cost. Our ISO-17025 lab in Indianapolis is certified for measurement to 50 GHz and can verify the accuracy and measurement uncertainties of our instruments with traceability to NIST. CMT specializes in Vector Network Analyzers and Automatic Calibration Modules (ACMs) and nothing else. We are highly focused on providing a world-class product at a very attractive price.
You might ask “Why are Vector Network Analyzers so expensive?”. The answer to this is nuanced. Other suppliers of VNAs might use previous RF synthesizer designs from other equipment they offer to include in the VNA internal RF sources. They might also borrow digitizer designs from other high-end equipment. The result is design over-kill which increases product cost. A VNA does not need spectacularly low phase-noise sources. The phase noise just needs to be low enough that it doesn’t degrade trace noise for high-level measurements. (At low levels, the trace noise is dominated by the receiver noise floor). Trace noise on a CMT VNA is between 0.001 and 0.002 dB RMS, which is excellent.
Choosing the right components in the VNA design to meet the accuracy and noise criteria results in a lower product cost which is passed along to the customer as a lower sales price. Additionally, building a VNA with its own embedded Windows operating system is a dated design methodology. Computer hardware and software evolve much too quickly to burden a piece of test equipment with a static computing solution. It made some sense to do this fifteen or twenty years ago, but after computer speeds improved and USB was available for connection it ceased to be a smart approach. Today’s laptop computers have all the power needed to run the CMT user interface which operates the VNA.
A combination of smart choices for internal signal sources, a custom lower cost bridge design, and elimination of the internal Windows operation system, among other factors, results in a low-cost vector network analyzer with world-class performance. See our entire line of Vector Network Analyzers at www.coppermountaintech.com.
To provide the best experiences, we use technologies like cookies to store and/or access device information. Consenting to these technologies will allow us to process data such as browsing behavior or unique IDs on this site. Not consenting or withdrawing consent, may adversely affect certain features and functions. We will not sell your information to third parties.
Functional
Always active
The technical storage or access is strictly necessary for the legitimate purpose of enabling the use of a specific service explicitly requested by the subscriber or user, or for the sole purpose of carrying out the transmission of a communication over an electronic communications network.
Preferences
The technical storage or access is necessary for the legitimate purpose of storing preferences that are not requested by the subscriber or user.
Statistics
The technical storage or access that is used exclusively for statistical purposes.The technical storage or access that is used exclusively for anonymous statistical purposes. Without a subpoena, voluntary compliance on the part of your Internet Service Provider, or additional records from a third party, information stored or retrieved for this purpose alone cannot usually be used to identify you.
Marketing
The technical storage or access is required to create user profiles to send advertising, or to track the user on a website or across several websites for similar marketing purposes.
To provide the best experiences, we use technologies like cookies to store and/or access device information. Consenting to these technologies will allow us to process data such as browsing behavior or unique IDs on this site. Not consenting or withdrawing consent, may adversely affect certain features and functions.
Functional
Always active
The technical storage or access is strictly necessary for the legitimate purpose of enabling the use of a specific service explicitly requested by the subscriber or user, or for the sole purpose of carrying out the transmission of a communication over an electronic communications network.
Preferences
The technical storage or access is necessary for the legitimate purpose of storing preferences that are not requested by the subscriber or user.
Statistics
The technical storage or access that is used exclusively for statistical purposes.The technical storage or access that is used exclusively for anonymous statistical purposes. Without a subpoena, voluntary compliance on the part of your Internet Service Provider, or additional records from a third party, information stored or retrieved for this purpose alone cannot usually be used to identify you.
Marketing
The technical storage or access is required to create user profiles to send advertising, or to track the user on a website or across several websites for similar marketing purposes.