


What is a Vector Network Analyzer vs Spectrum Analyzer?
May 25, 2023Introduction
It’s natural to wonder, “Can a network analyzer be used as a spectrum analyzer”? A vector network analyzer (VNA) is very different from a spectrum analyzer (SA). So what does a network analyzer do? A VNA is used to measure the transmission and reflection characteristics of a Device Under Test (DUT), and the spectrum analyzer is suitable for measuring the amplitudes of frequencies applied to its input. Can you measure impedance with a network analyzer? Yes and you can learn more about measuring impedance with a VNA in this article. Where an oscilloscope might display the time domain response of a number of input signals, an SA displays the Fourier transform of the signals, showing the distinct amplitude of each frequency component.
Figure 1 and Figure 2 show an oscilloscope and a spectrum analyzer measurement of two signals, one at 130 MHz and the other at 220 MHz.

Figure 1 – Oscilloscope Measurement of 130 and 220 MHz Signals

Figure 2 – Spectrum Analyzer Measurement of 130 and 220 MHz Signals
The utility of the spectrum analyzer is clear. It distinctly shows the amplitude of the two frequency components separately, where the frequency content of the oscilloscope measurement is difficult to interpret.
What Does a Typical Spectrum Analyzer Block Diagram Look Like?
There are major differences between the block diagrams of an SA and a VNA. A typical SA block diagram is shown in Figure 3. Double conversion (double heterodyne) is required to ensure that mixer images are not an issue. Additionally, the Local Oscillator (LO) sources, particularly the first one in the block diagram below, must be free of spurious signals, and high order intermodulation products (IMs) must now show up in the 15 GHz IF. If IMs cannot be avoided, then an additional IF path must be switched in, and the first LO offset changed accordingly. In other words, a 15.15 GHz IF filter might be switched in instead of the 15 GHz filter, and the first LO would be moved up by 200 MHz for this IF path and only for frequencies where there are unavoidable spurs in the first IF frequency.
The SA is therefore a broadband tracking receiver and displays the amount of existing RF power at each frequency within an IF bandwidth determined by FIR filtering in the DSP section.

Figure 3 – Possible Spectrum Analyzer Block Diagram
Some spectrum analyzers come with a tracking generator. The generator sweeps along with the tracking receiver. With the generator attached to the input of a DUT and the output connected to the SA input, you can measure the frequency response of a DUT. This function is similar to what a VNA does, but a VNA would be much more precise and include phase information.
What Does a Typical VNA Block Diagram Look Like?
A VNA has a much simpler RF architecture. A stimulus signal, which steps from a start frequency to a stop frequency, passes to a DUT, and tracking receivers measure signals which pass through and are reflected back. The receivers are only sensitive to signals at the generated stimulus frequency and only within the IF bandwidth of measurement.
A typical VNA block diagram is shown in Figure 4. The stimulus signal is routed to either Port 1 or Port 2 and passes through a directional bridge on each side. The bridges are capable of separating signals by direction of travel, so the two output ports of the bridges are a sample of the amount of signal leaving the port and the amount entering the port. A mixer on each port of each of the bridges reduces the high stimulus frequency to a much lower IF frequency, usually below 20 MHz. The constant frequency IF is digitized, and a low latency DSP filter is used to apply the IF Bandwidth (IFBW). Only a single conversion is done, not dual as in a spectrum analyzer.
A block diagram such as this is susceptible to mixer image ambiguity. For instance, if the LO is 10 MHz above the stimulus to create a 10 MHz IF, then the desired response is caused by a signal 10 MHz below the LO, but a signal 10 MHz above will also create the very same IF signal. However, that is not how a VNA operates. There is only one signal— the stimulus— and it is completely controlled by the VNA and is always at LO-IF in frequency. The image is not an issue for normal VNA measurement so a single conversion (homodyne) architecture is acceptable.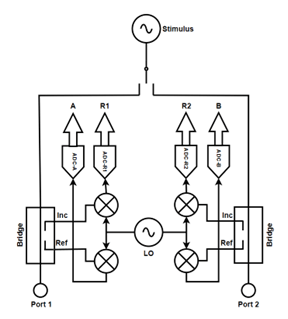
Figure 4 – Typical VNA Block Diagram
The receivers in the VNA are also tracking receivers as in an SA, and you can use a VNA as a rudimentary SA by turning off the stimulus signal and observing the signal power measured by one of the receivers— A or B — which respond to signals entering VNA ports one or two respectively.
A single signal applied to the VNA will show two responses— one at the actual frequency and another at the image, or twice the IF frequency lower. There may also be some small spurious signals from the LO. A VNA LO does not have to be pristine like the ones used in an SA, since the VNA normally only measures its own stimulus frequency.

Figure 5 – VNA Used for Spectrum Analyzer Measurement, 1 kHz IFBW and 100 kHz Span
Figure 5 shows a signal close to 2.3 GHz being measured by the A receiver of the VNA. The VNA stimulus source has been turned off and the absolute A receiver measurement has been chosen with a 100 kHz span around 2.3 GHz. The side lobes of the low latency VNA IF Bandwidth filter implemented in DSP are clearly visible. An SA would use a DSP with minimal sidelobes since accurate signal visualization is more important than measurement speed. The DSP IF filter in the VNA is optimized for lowest delay to reduce measurement speed. The sidelobes of the VNA IF filter do not degrade VNA measurement accuracy, but the result is not as clean as an SA measurement would be.
Figure 6 shows a close-up of the 1 kHz IF filter in the VNA. To be clear, a perfectly pure input signal will look like this if displayed by the VNA in this narrow span with the IF Bandwidth set to 1 kHz.

Figure 6 – VNA 1 kHz DSP IF Filter, 20 kHz Span
For various reasons, the power accuracy of a the VNA spectral measurement is only accurate for spans of about 100 kHz. In this narrow span, the image signal will not be visible along with the desired signal.
Figure 7 shows an actual spectrum analyzer measurement of a signal with 1 kHz IF BW and 100 kHz span, just like the measurement of Figure 5. There are no side lobes, as the DSP IF filter is optimized to minimize them in this device.

Figure 7 – Actual Spectrum Analyzer Measurement with 1 kHz IFBW and 100 kHz Span
Conclusion:
A spectrum analyzer is intended to visualize the spectral components of input signals. Its architecture is optimized for clean visualization of signals without visible side-lobes or spurious signals. A vector network analyzer is intended to only measure its own stimulus signal, and its architecture is optimized for fast measurement speed. So, how does a VNA work? A VNA can be used as a rudimentary spectrum analyzer, but it isn’t optimized for the task. To do so would require a much more complicated architecture and would significantly increase the product cost. So, how does a vector network analyzer work? Watch this webinar on VNA basics to learn more.