

Vector Network Analyzer
August 30, 2023What is a Vector Network Analyzer?

The vector network analyzer working principle is as follows: A stimulus signal is generated and routed to a port of the vector network analyzer (VNA). A typical vector network analyzer block diagram is shown here. The stimulus signal is routed to either Port 1 or Port 2 and passes through a directional bridge on each side. The bridges are capable of separating signals by direction of travel, so the two output ports of the bridges are a sample of the amount of signal leaving the port (incident) and the amount entering the port (reflected). A mixer on each port of each of the bridges reduces the high stimulus frequency to a much lower IF frequency, usually below 20 MHz. As the stimulus frequency changes, the Local Oscillator (LO) tracks with it, offset above it by the IF frequency. The resulting constant frequency IF is then digitized, and a low latency DSP filter is used to apply the IF Bandwidth (IFBW) and improve the signal to noise ratio. After filtering, the IF which was sampled at 40 MHz or so can be heavily decimated since the information bandwidth might be only 10 kHz. The greatly reduced bit rate data is then moved out over the USB bus to the host computer for processing.
How does a Vector Network Analyzer Work?
It is the measurement bridge which makes the VNA different from other test equipment. Its ability to separate and measure signals traveling in the forward and reverse directions allows for the calculation of “S-Parameters”. If a 2-Port DUT is measured in in each direction and all four S-Parameters collected, they may be used to predict how the DUT will react with different drive impedances and different load impedances.
For a 2-Port system, there are four S-Parameters. S11, S12, S21 and S22. These are derived from the four receiver measurements, R1, A, R2 and B. The S-Parameters are ratioed values such that the absolute power level of the stimulus is irrelevant. They are:

The “R” receivers are the “reference” receivers, the measurement of the outgoing stimulus signal. The A and B receivers measure signals entering each port. S11 for instance gives the ratio of the reflected signal from a DUT seen on port 1 to the incident signal leaving port 1. S21 gives the ratio of the signal passing through a DUT and entering port 2 to the signal leaving port 1.
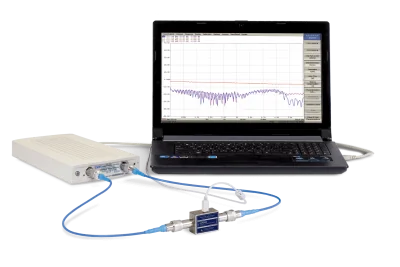
You can learn more about VNA basics in this vector network analyzer basics PDF from a webinar. There is also a vector network analyzer tutorial in two parts, here and here. With the advent of USB vector network analyzers, the smaller equipment form-factor allows for measurements to be made anywhere in the lab. And with the technology available today, VNA lab results are not different than the field results. The small, portable VNAs are stable and accurate enough to capture reliable results in any environment. For those tumultuous environments with dust and water and other elements to consider, these small VNAs can be inserted into a housing that protects it.
The software for a USB vector network analyzer runs on an external computer. The measurement module itself holds no data, all the measurement information is processed and saved on the computer to which it is connected. The vector network analyzer software from CMT is free and available to download at any time on the website. It includes many advanced analytical features, like time domain and gating, power sweeps, frequency offset mode, and more. The software can be used with test automation programs, like LabVIEW, Python, MATLAB, .NET, among others. With the software and test automation being run on the same computer, there is limited latency in the measurements.
Is a VNA the Same as a Network Analyzer?
What is the difference between VNA and network analyzer? It should be noted that a “Network Analyzer” (No Vector in front) is a test device used to analyze ethernet networks and is not at all the same as a Vector Network Analyzer. An ethernet Network Analyzer does not make RF S-Parameter measurements.
A Vector Network Analyzer can act somewhat like a Spectrum Analyzer. If the stimulus is turned off and a signal is applied to a port, the receiver will show a response just like a spectrum analyzer.
A spectrum analyzer is designed to measure externally applied input signals with high resolution. A VNA is designed to measure its own generated signal and do so very quickly. The DSP IF filter of the spectrum analyzer is very sharp with no side-lobes where the DSP IF filter of the VNA is more rounded with side-lobes like a sine(X)/X sync pulse. This filter is designed for low latency to make measurements very quickly. The VNA has only one mixing stage and a single signal input will produce two responses on the screen. One where the RF is at LO-IF and one where it is at LO+IF. The lower frequency signal will be at the correct frequency. A spectrum analyzer has more than one mixing stage to eliminate this “image” problem and only the one correct signal will be seen.
A VNA is not at all the same as a spectrum analyzer and is designed for low cost and high measurement speed. It is optimized to work with its own generated signal and not to take in externally generated signals.
There are also scalar network analyzers and large signal network analyzers. A scalar network analyzer, or SNA, measures only the amplitude properties of a DUT and provides no phase information. An SNA is basically a spectrum analyzer with a tracking generator. The difference between scalar and vector network analyzer is that the vector network analyzer measures both amplitude and phase of signals reflected from and passing through a DUT. This S-Parameter information is comprehensive and sufficient to completely characterize the DUT over the measured frequency range. A Touchstone file containing the S-Parameters may be used in a simulation engine to examine how the DUT will perform with any source or load impedance. The scalar network analyzer will only show the magnitude of the frequency response of a DUT and only with its current drive impedance and load. The scalar analyzer does not produce a Touchstone file for further analysis and simulation. A large signal network analyzer (LSNA) measures devices under large signal conditions and analyzes harmonics and non-linearities. LSNAs were previously known as Microwave Transition Analyzers.
What Can You Use a VNA For?
With innovative engineers pushing technology forward at such a rapid speed, it may be considered, ‘What can you do with a VNA?’ A VNA is an extremely useful tool for RF design. If an amplifier circuit is being created, a VNA can be used to measure the characteristics of the circuit. The gain, return loss and P1dB compression can all be measured easily. It is particularly important to consider that some amplifiers are only conditionally stable. If a filter is placed before or after the amplifier, the source or load impedance presented to the amplifier may wander into an unstable area and the circuit may oscillate. Linville stability of the amplifier may be determined from its S-Parameter measurements and the source or load impedance of the filter can be checked to see if there will be stability problems. Only a VNA can accomplish this task.
The passbands and stopbands of filters may be evaluated with a VNA. CMT VNAs have industry leading dynamic range to allow for simultaneous measurement of filter insertion loss and deep stopbands. The VSWR or return loss of the input of an antenna can be measured. It is assumed that if the return loss is low –very little reflection—then the signal must be radiating away as desired. The operating bandwidth of the antenna and the effect of nearby ground or metallic surfaces may be evaluated.
Using the time domain feature, it is possible to evaluate the health of a long feedline to an antenna. Characteristic impedance vs distance can be charted. Water ingress—a common problem with outdoor antennas—at the antenna interface will present a much lower impedance.
Using the frequency offset feature, upconverter and downconverter conversion loss for communications and satellite systems may be measured.
Why do we use a VNA in RF circuits? This versatile tool provides essential information to the RF engineer in many different industries.
Millimeter-wave VNAs can be used to measure the dielectric properties of materials. Focused beam measurement systems using CMT VNAs like those supplied by Compass Technologies enable highly accurate material characterizations.
New advances in microwave imaging allow a VNA to be used in medical applications. The MammoWave® breast cancer detection system from UBT includes an embedded VNA from CMT.
A VNA can be used to measure soil moisture content. Water has a very high dielectric constant, about 80. Dry soil will have a dielectric constant between 3 and 5. Moist soil can have any dielectric constant in between but will certainly be higher than 5. Because the magnitude of an RF reflection is proportional to the ratio dielectric constants of the two media, air and soil, the amount of moisture content can be evaluated. Mounting a miniaturized VNA like an R140B 14 GHz 1-Port VNA on a drone along with a GPS system allows mapping of soil moisture over large areas.
How Do You Measure Antenna Gain Using a Network Analyzer?
A common inquiry we get from engineers is how to measure antenna gain using a network analyzer. With the increase of connected devices and wide reach of IoT for business and consumers, antenna performance is so important. Antenna gain is an important measurement, because certain gain figures are better suited to particular usage environments. For strictly urban use, a unity gain antenna is ideal. Because a unity gain antenna sends the maximum signal above the horizon at a high angle, it is excellent for areas where there are tall buildings or mountains. For people who live in suburban or rural areas, 3 dBd (3 dB more gain than a dipole antenna) gain is recommended. The 3 dBd gain antenna concentrates the maximum amount of signal at the horizon while maintaining a good high-angle signal. If you are a cellular user, there is no need to buy an antenna stronger than 3 dBd gain as the USA cellular infrastructure is designed for optimum performance using 3 dBd gain antennas. If you are using a Land Mobile Radio (LMR) system and are in a rural area, a 5 dBd gain antenna is suggested, as this will help to provide the maximum amount of signal at the horizon with very little high-angle signal. Finally, the gain is a practical value that describes the capability of an antenna to concentrate energy in a particular direction of space.
So how is it measured? There are two methods to measure antenna gain. If the frequency is high enough, such that measurement of the Antenna Under Test (AUT) can be performed by a reference antenna with known properties at a distance which is several wavelengths away (far field), then a simple S21 measurement can be made between the two antennas, preferably in an anechoic chamber. The AUT is often mounted on a gimbal and turned and tilted up and down incrementally to plot the full 3D antenna gain pattern. The known gain of the reference antenna can be backed out of the measurement to arrive at the AUT gain alone.
For lower frequency antennas such as VHF and UHF, gain is usually measured in the field. A signal source is applied to an illuminating antenna. The measuring VNA is located far enough away to ensure that arriving waves are nearly planar. A reference antenna is attached to one port of the VNA and the AUT is attached to the other. The internal stimulus source of the VNA is switched off and the receivers are set to receive the illuminating signal. Taking the ratio of the received signals from the AUT and the reference antenna allows for a calculation of antenna gain. The illuminating generator and the VNA must always be aligned to the same frequency and the reference antenna and AUT must be far enough apart that they don’t interfere with each other.
For more information on antenna measurements, we have an eBook done in collaboration with Microwave Journal on Precision Antenna Meaurements available.