

VNA Measurement for High-Speed Digital Signal Integrity
July 7, 2022Introduction
High-speed digital signals are commonplace in a variety of applications, and one of the most common carriers of digital signals is the HDMI cable. This cable contains four, 100Ω twisted pairs and a number of other signaling and power lines. Data speeds run from 4.95 GBps for 1080i video to 48 GBps for 8k video at 60 Hz or 4k video at 120 Hz frame rate for various classes of HDMI cables.

In automotive applications, a vehicle may have one or more video cameras with each sourcing a 3.5 GBps serial data rate to support a 1920×1080 RGB display at a 60 Hz rate. An automobile is a very noisy environment for digital data, and different methods are employed to mitigate these effects. First, the data will often be recoded to maximize bit transitions to allow for successful clock recovery and to balance the running sum of 1’s and 0’s to prevent the development of a DC offset in the bitstream. A coding method called 8B/10B is commonly used for this purpose. The serial data may also have pre-emphasis added and post-processing at the receiving end might be used to improve signal integrity.
VNA Analysis for Digital Media
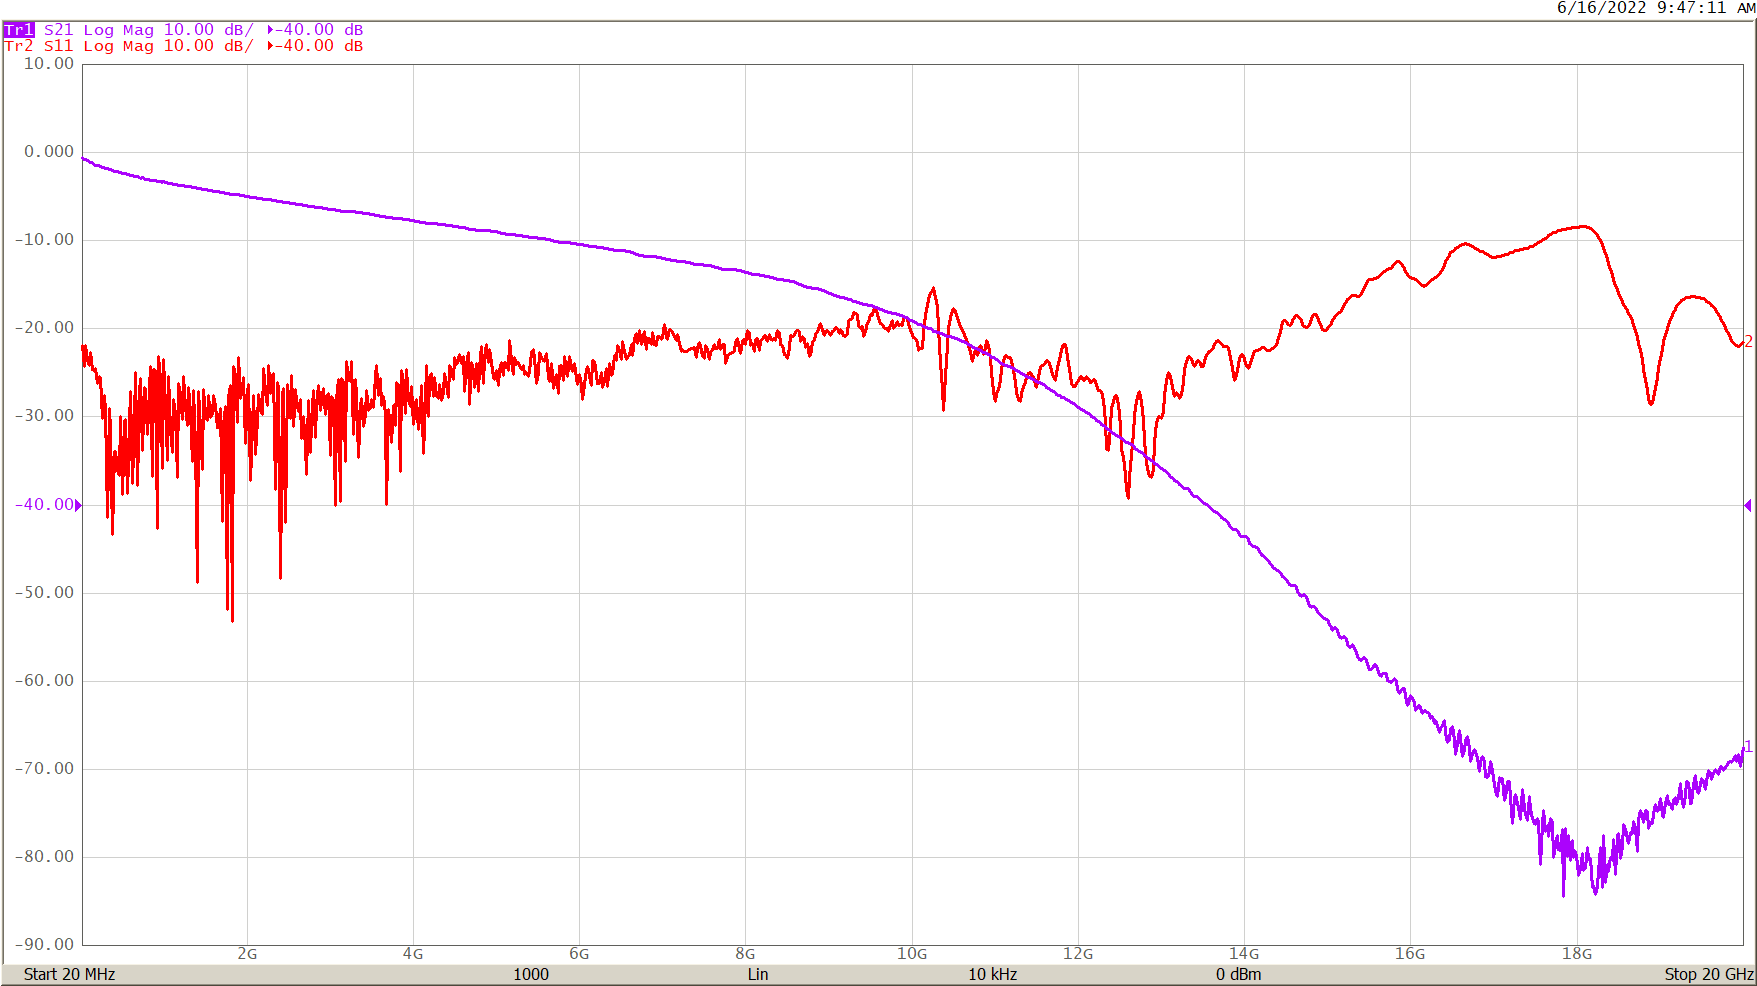
Figure 1: RG174 Insertion Loss and Return Loss
Insertion loss, reflections, and dispersion in the digital transport medium all contribute to signal degradation. A vector network analyzer (VNA) can measure the media and quantify impairments. For example, a three-meter length of RG174 cable is measured in Figure 1. The insertion loss exceeds 20 dB above 10 GHz which limits its usefulness to lower digital data rates.
The delay through the cable in Figure 2 is reasonably flat over the useable range. The decreasing delay at the high end isn’t necessarily valid due to the increasing phase uncertainty at lower measurement levels. Delay is calculated by the VNA from the change in S21 phase divided by the change in frequency. Delay variation or dispersion causes higher frequency elements of a digital bitstream to arrive at a different time from lower frequency elements. This stretches out the total bit time and may result in it intruding into the time frame of the next bit. This is called Inter-Symbol Interference, or ISI.
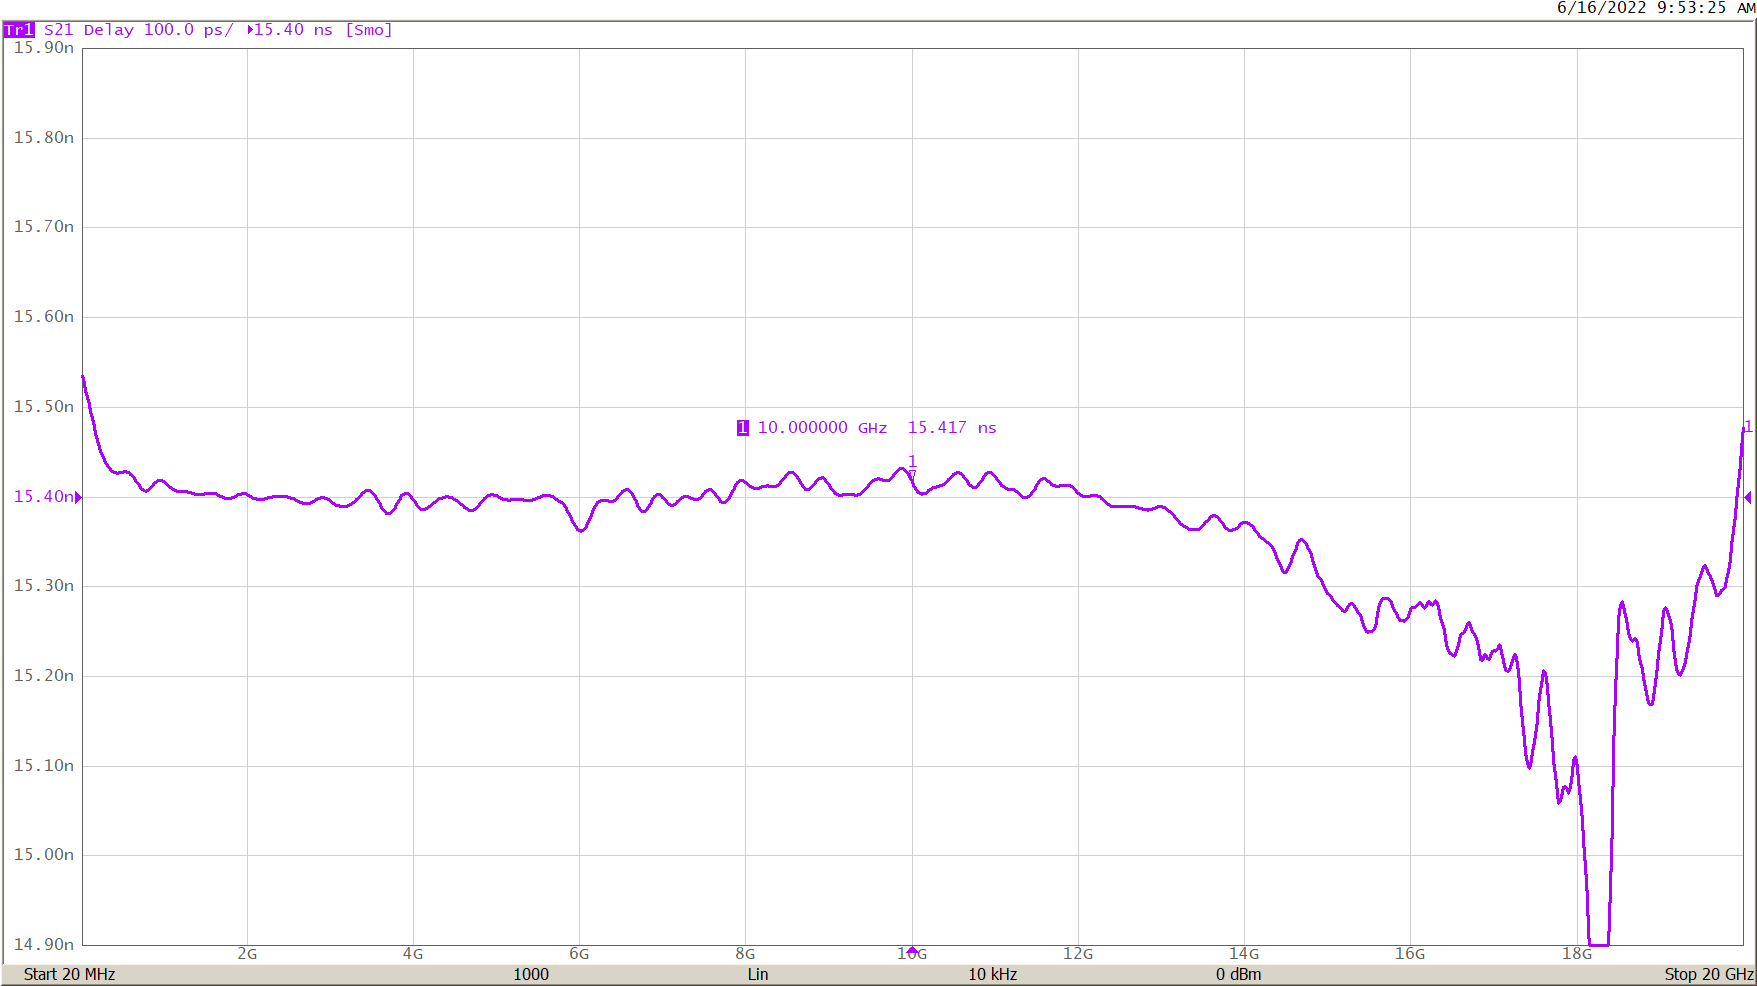
Figure 2: RG174 Group Delay
The delay through this 3m cable is 15.4 nS which is consistent with a velocity factor of 0.65 for PTFE dielectric.
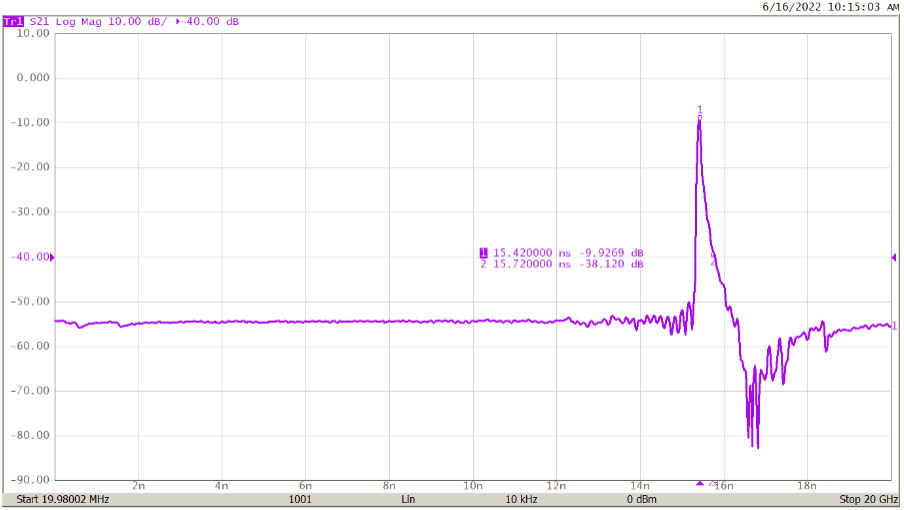
Figure 3: RG174 Impulse Response
Switching the VNA to time domain lowpass impulse response, it is possible to see the S21 impulse arriving at Port 2 after the 15.4 nS delay in Figure 3. The width of the measured impulse is about 600 pS. The minimum impulse width is about 50 pS in this measurement bandwidth, so the measurement is valid. The VNA minimum pulse width is given in the Window setting of the S2VNA and S4VNA Time Domain menu or on the main screen for the SNVNA software.
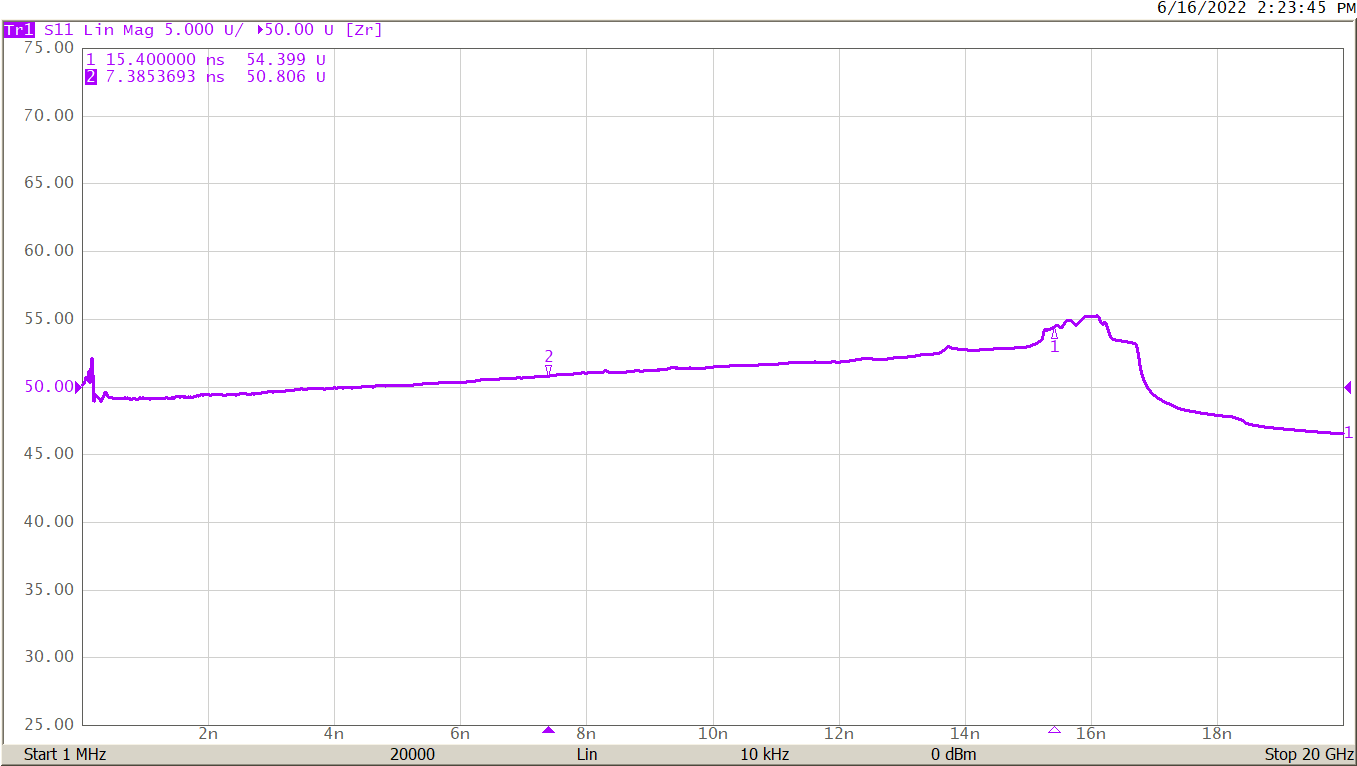
Figure 4: Characteristic Impedance vs Distance
Figure 4 shows the characteristic impedance over the length of the cable. Marker 1 at the end of the cable shows the impedance variation at the SMA connector and everything past that point is within the VNA itself. Measurement of impedance over distance is very useful to analyze the effects of layer changes on a PCB or transition to a high-speed connector. Vias on through-hole connectors add capacitance and will present a lower impedance to signals. Surface-mount connectors may show better performance.
Taken together, this information gives a complete picture of the cable we might use for digital signal transport.
Using the VNA Data
If a random bitstream with a 5 GBps rate is created as in Figure 5, it can be convolved with the S21 impulse data of Figure 3 in order to visualize the expected degradation.
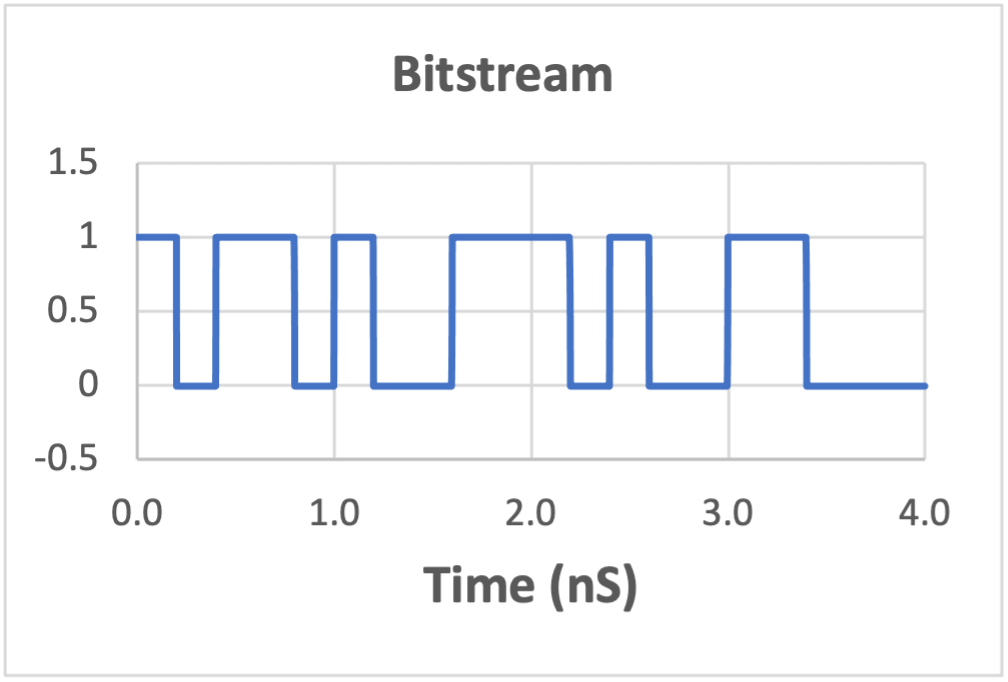
Figure 5: 5 GBps Bitstream
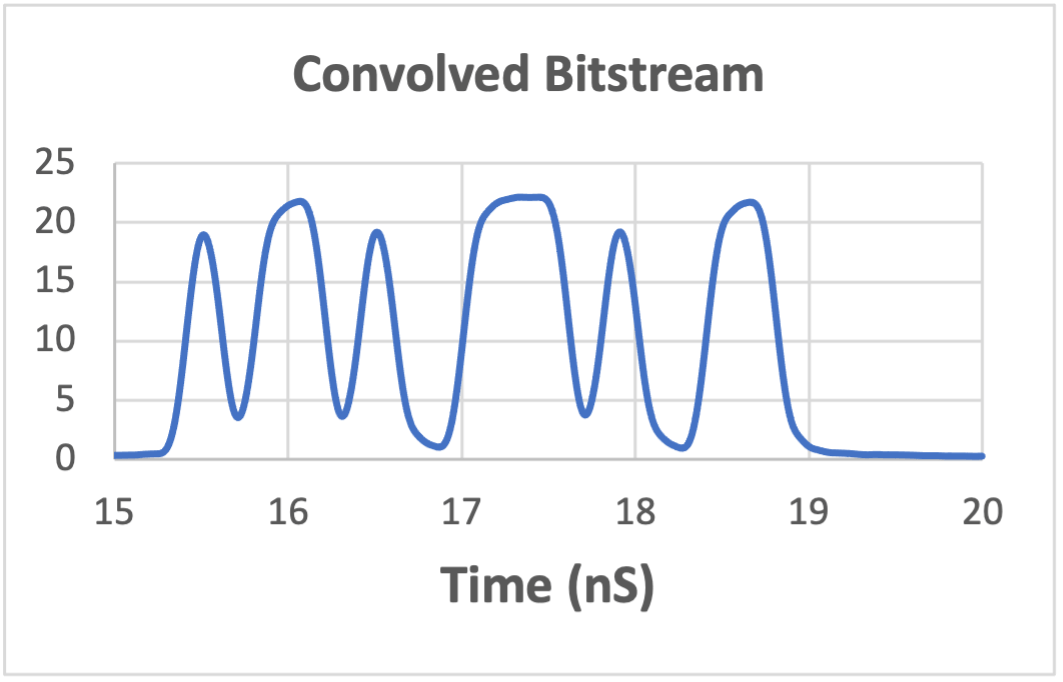
Figure 6: Convolved Bitstream
The trace data for the S21 time domain lowpass impulse response of Figure 3 was saved to a file and then convolved with the bitstream using Python. The result in Figure 6 exhibits the 15.4 nS delay, plus a great deal of impairment due to the restricted bandwidth of the cable. If it were a requirement to use this cable, the data rate might need to be reduced until the degradation became acceptable.
Using a simple DSP derivative, the bitstream might be pre-emphasized as in Figure 8 to amplify the high-frequency content somewhat and perhaps improve the outcome.
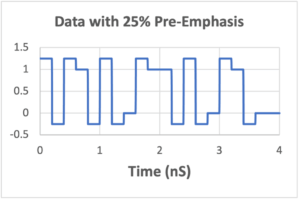
Figure 7: Pre-Emphasized Data
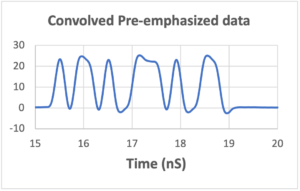
Figure 8: Convolved Pre-Emphasized Data
The pre-emphasized and convolved data has somewhat
better amplitude balance although the single bits are still badly compromised. Post-processing would improve the bitstream further.
HDMI Cable Testing
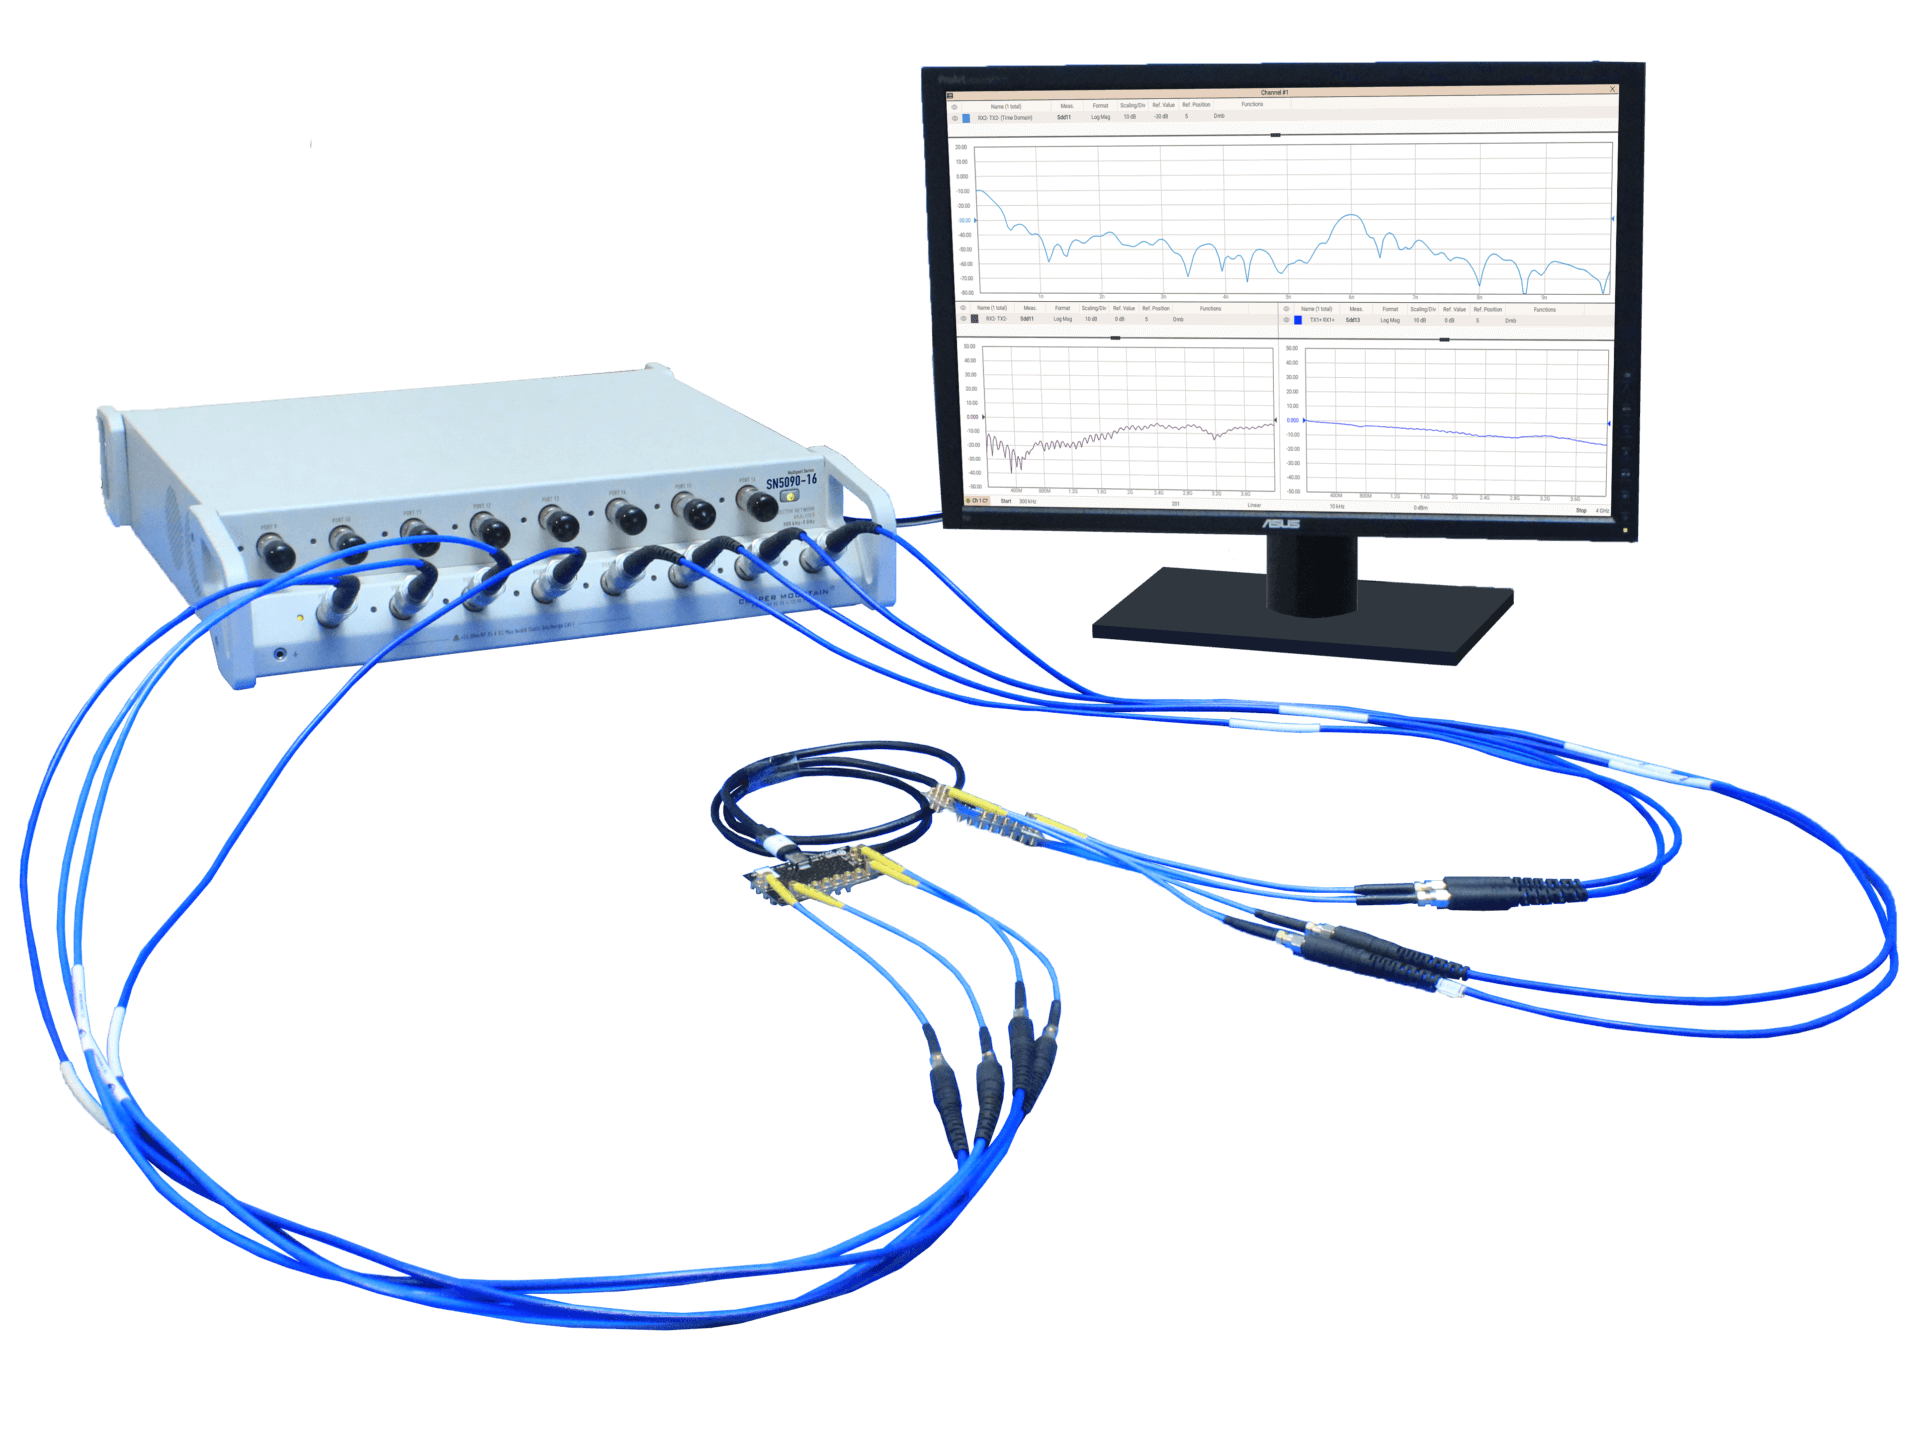
Figure 9: SN5090-16, 16-port USB VNA
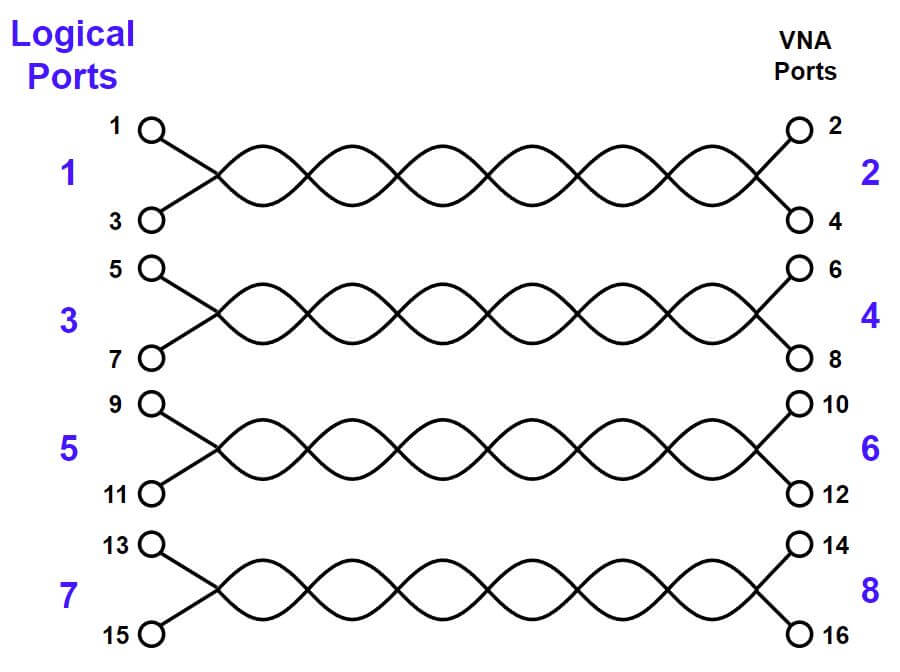
The four twisted pairs in an HDMI cable can be efficiently evaluated using a 16-Port VNA. Each port is connected to one wire of a twisted pair and unbalanced measurements are converted to differential measurements by selecting “Fixture Topology” and grouping ports into balanced pairs. For further discussion, the VNA is connected to the wires as shown below in Figure 10.
Although not obvious in Figure 10, ports 1 and 2 are connected directly, as are ports 3 and 4. The remaining pairs are connected similarly. With this arrangement, the differential insertion loss and return loss of the first pair are:


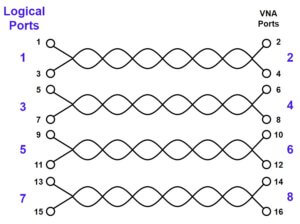
Figure 10: HDMI Cable Connections
Similarly, the other three twisted pairs may be evaluated, and certainly, these measurements could be made with a 4-port analyzer, moving the VNA connections to each pair in turn. Pairs that are not being measured must be terminated though so this method is time-consuming and tedious.
Additionally, it is important to measure the pair-to-pair crosstalk, Near-End Crosstalk (NEXT), and Far-End Crosstalk (FEXT). Measurement of NEXT amounts to making an isolation measurement between any two twisted pairs from the same end of the cable. These would be SDD31, SDD51, SDD71, SDD73, and SDD75. Measurements of FEXT are isolation measurements made on opposite ends of the cable and would be SDD41, SDD61, SDD81, SDD63, SDD83, and SDD85 from the logical port indexing of Figure 10. The reciprocal measurements for both NEXT and FEXT need not be measured since they will be identical. In other words, SDD13 = SDD31. All these differential terms are calculated in a similar manner. For instance, NEXT term:

Indexes 5 and 7 or 1 and 3 could be interchanged in this calculation since in this isolation measurement the choice of ports on the other pair is unimportant as there is no direct DC connection between the two pairs. Clearly, performing the Insertion Loss, Return Loss, NEXT, and FEXT measurements of four twisted pairs would be very time-consuming indeed without the use of a 16-Port Analyzer.
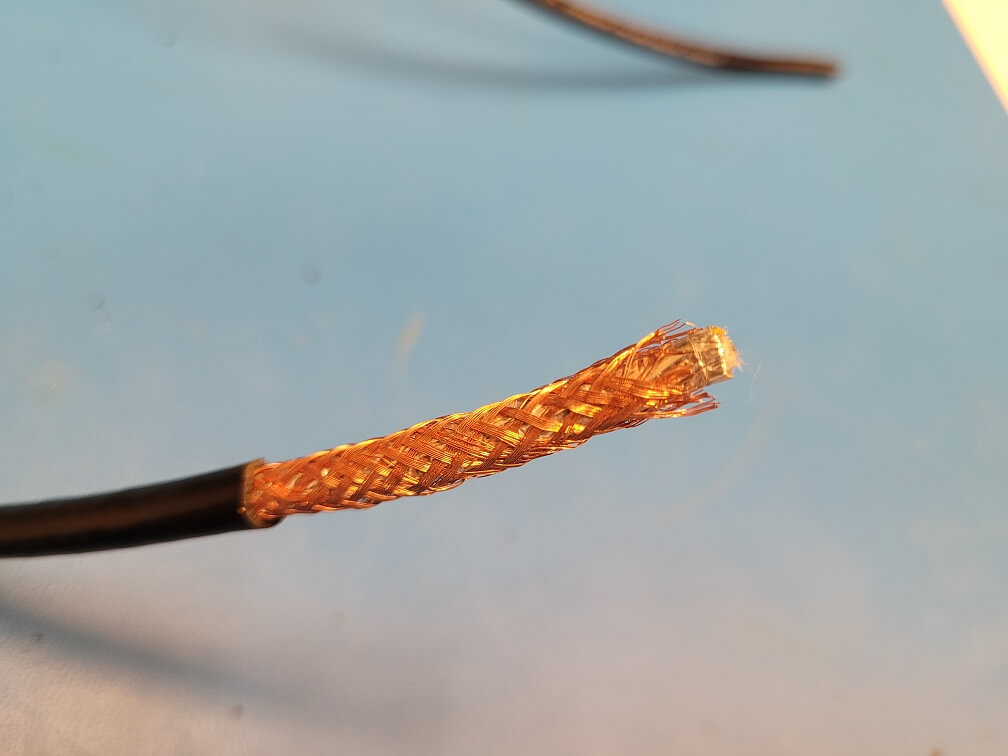
Figure 11: HDMI Outer Shield
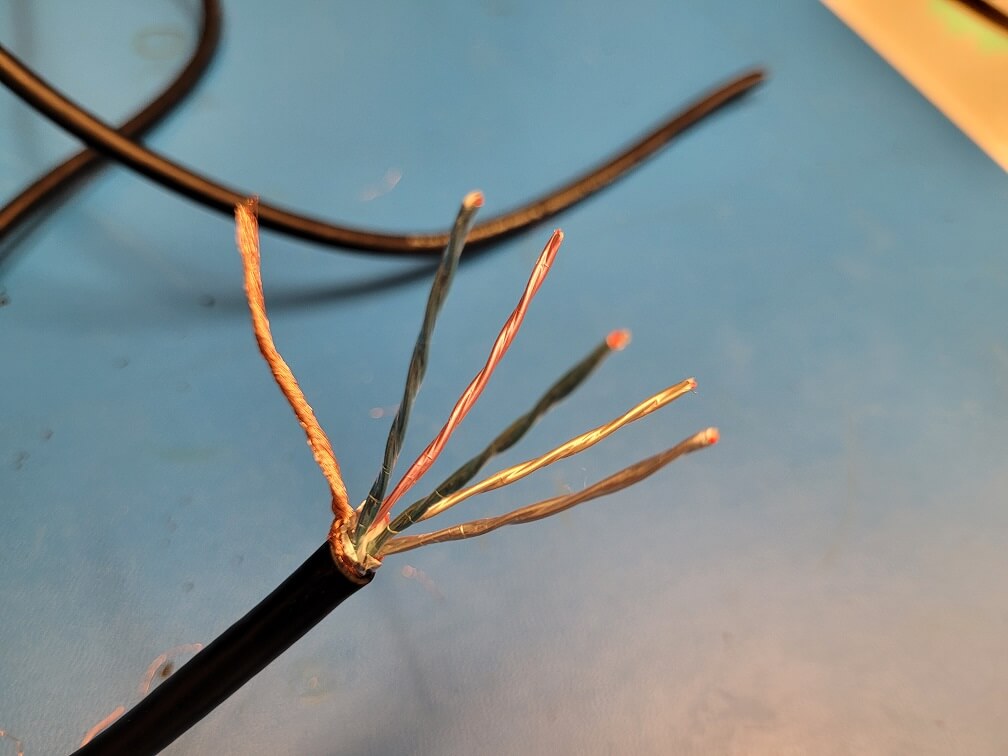
Figure 12: HDMI Shielded Pairs
An HDMI cable is constructed to insure high isolation between pairs. The four pairs and other connecting wires are bundled within a foil shield which is covered by a copper braid. Each pair is individually wrapped in a foil shield as well.
A typical NEXT measurement is shown in Figure 13. Ripple behavior is typical of this measurement.
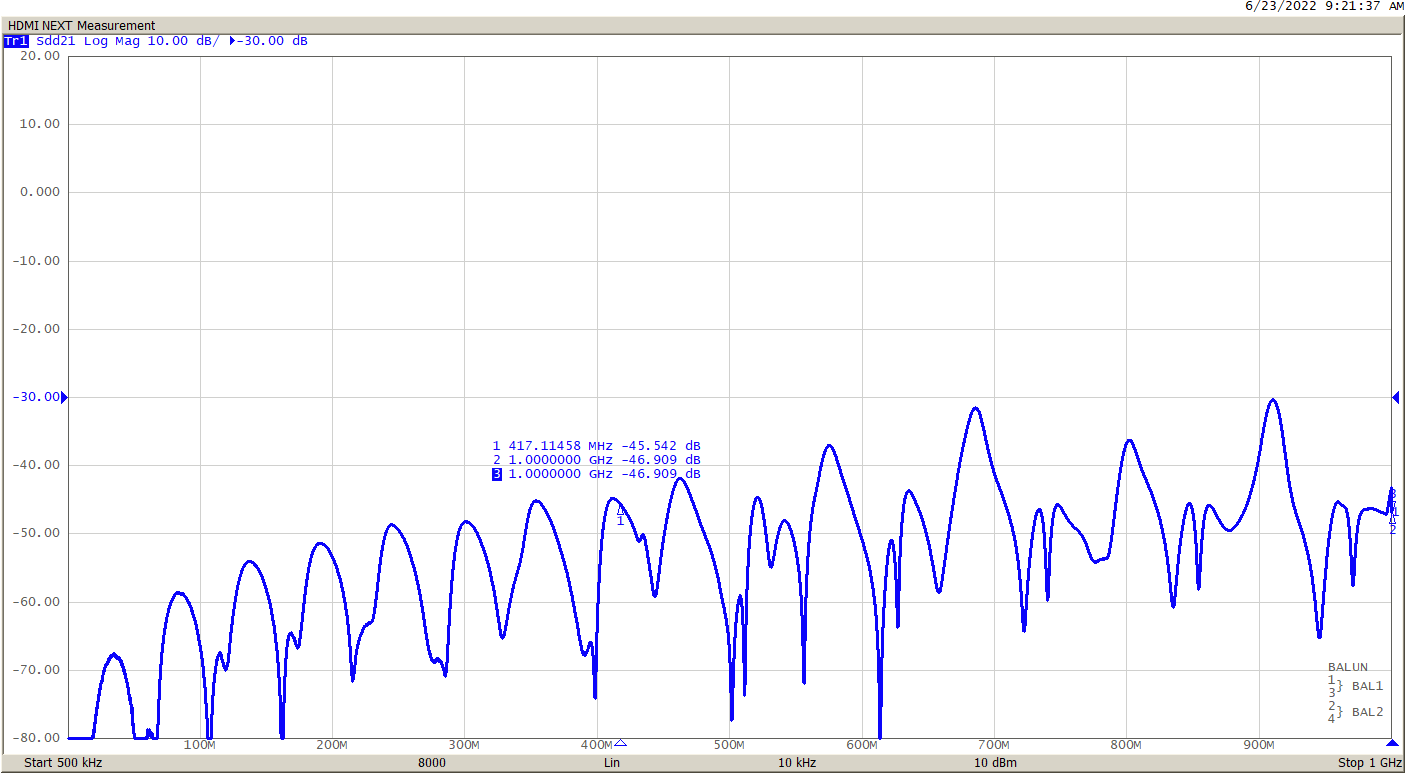
Figure 13: HDMI NEXT Measurement
Differential Measurement with the Multiport VNA
Differential mode setup on the Multiport VNA SNVNA software is quite simple. Unbalanced ports are selected in pairs and then combined into logical, differential ports.
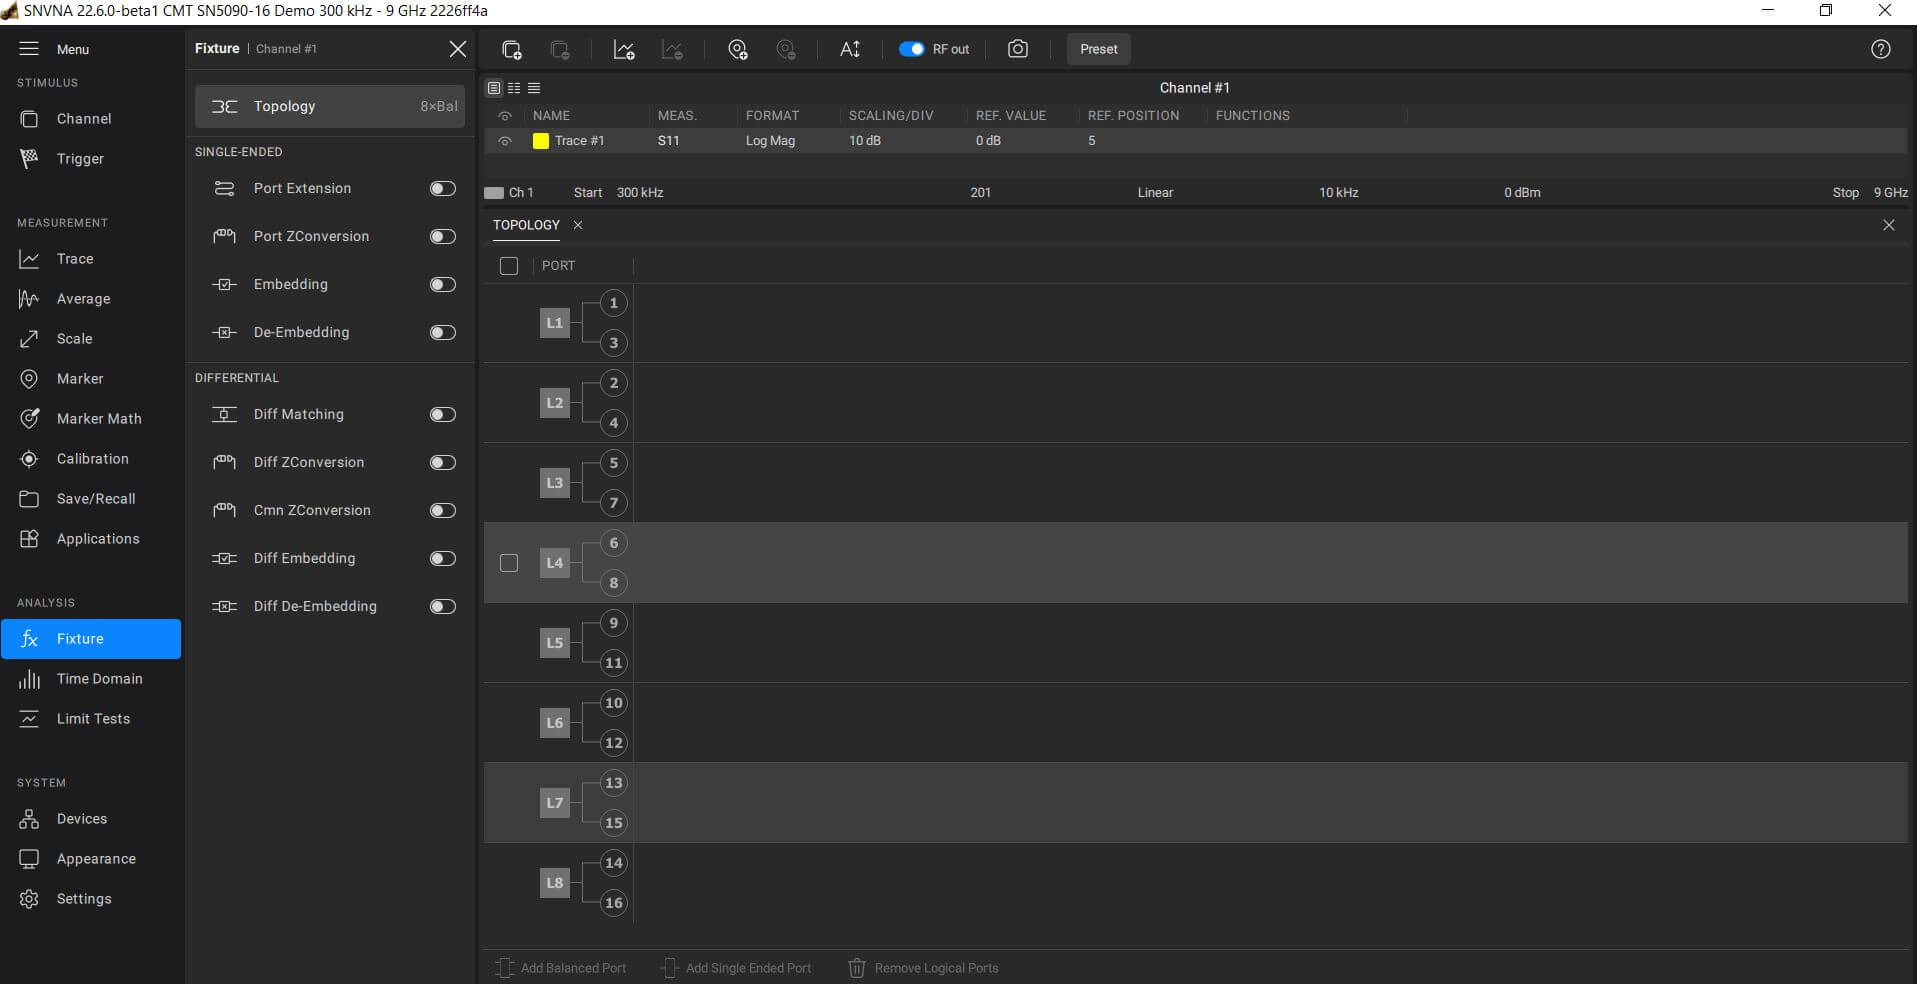
Figure 14: Multiport Differential Measurement Setup
Shown in Figure 14 are eight differential ports that would measure all four pairs of an HDMI cable simultaneously. A time domain measurement is easily set up as well.
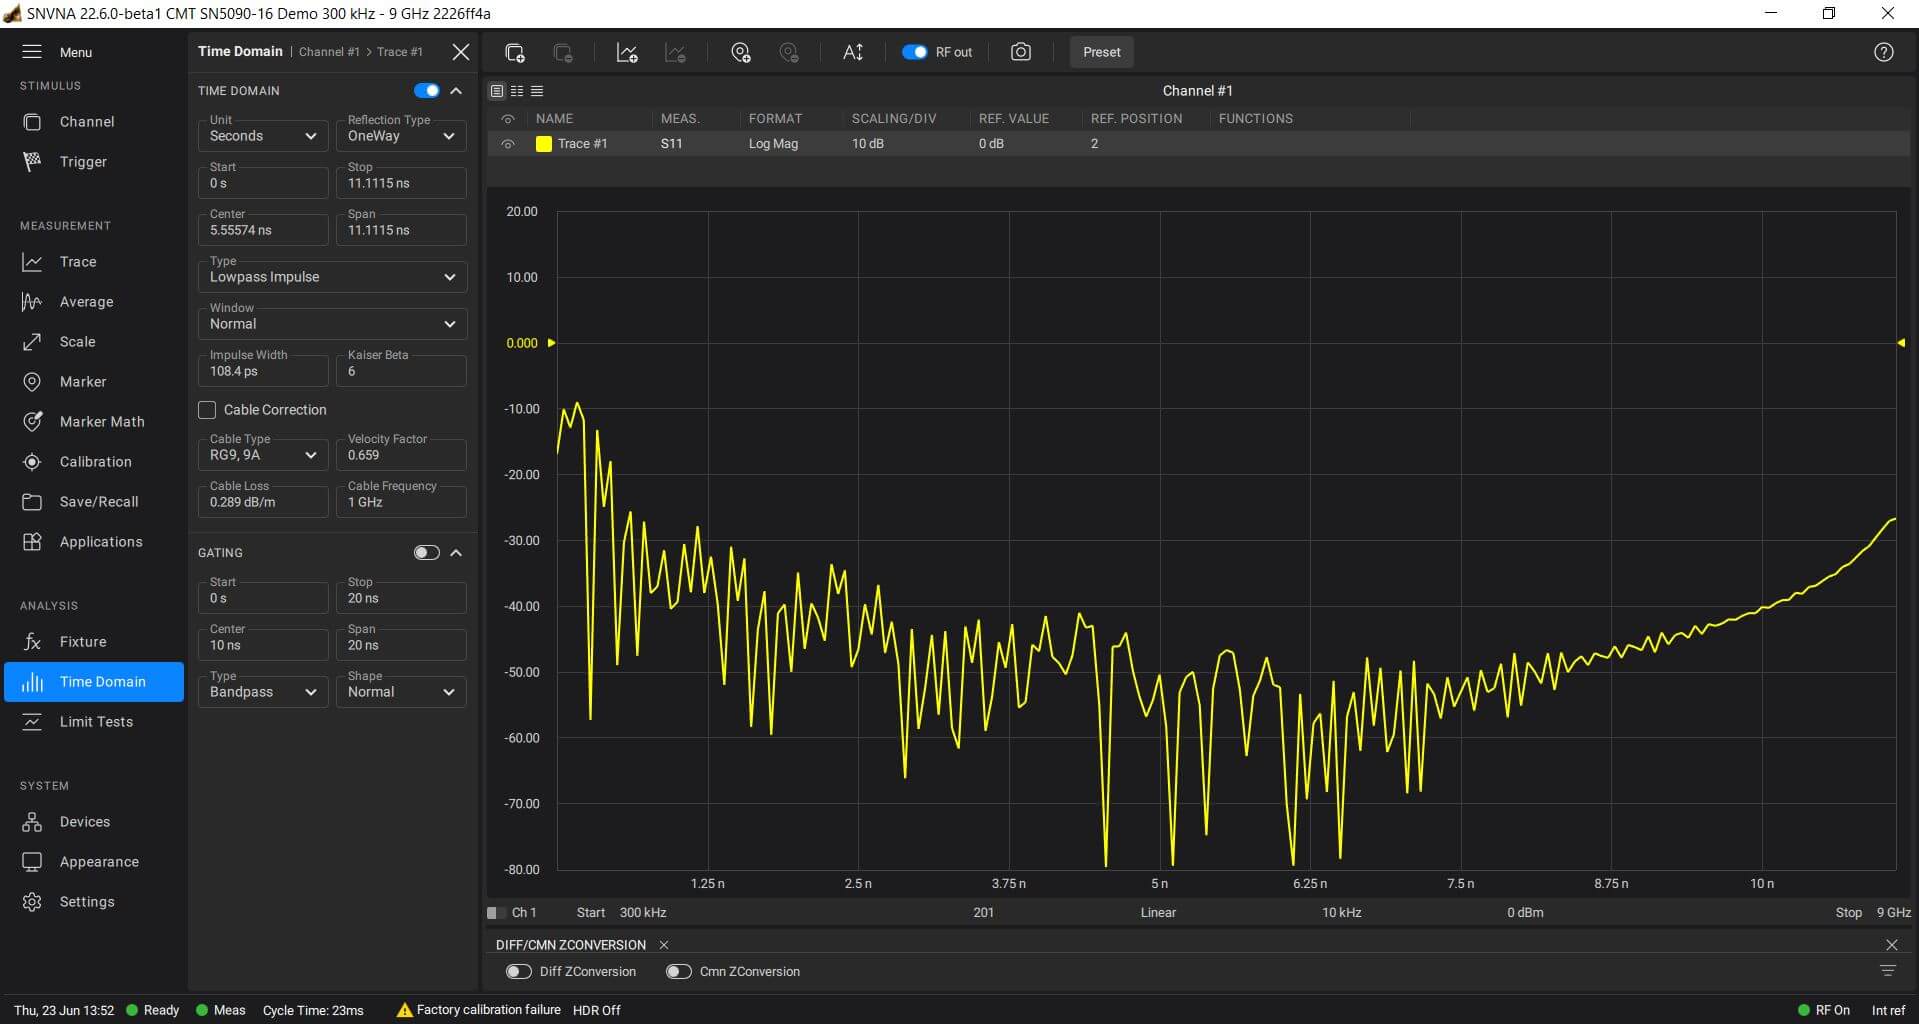
Figure 15: Multiport Time Domain Measurement Setup
Figure 15 shows the time domain setup in the SNVNA software. This can be used to view the Impulse response as shown in Figure 3 or the impedance over time or distance of any of the 100Ω twisted pairs as in Figure 4. With the logical ports defined as shown in Figure 14, the differential Insertion Loss, Return Loss of each pair, and NEXT and FEXT between any two pairs can be displayed on the screen. Additionally, limit lines may be set up to quickly test each of these measurements to a specification to judge the worthiness of a particular cable.
Conclusion
Vector network analyzers from Copper Mountain Technologies (CMT) provide measurement features that greatly simplify the analysis of media for high-speed digital signals. Time domain measurement capability, which comes standard with all VNAs except the M Series, allows for spatial analysis of media impairment and the ability to accurately predict high-speed digital signal degradation. Impedance over distance measurements can show where impairments exist in high-speed media and can help the designer decide what changes might be needed to improve performance.
With digital rates going ever higher the distinction between digital and RF becomes blurred. Proper use of RF tools is now a requirement for successful high-speed digital design. VNAs from CMT provide a very affordable and easy-to-use solution for signal integrity analysis.
Related Post
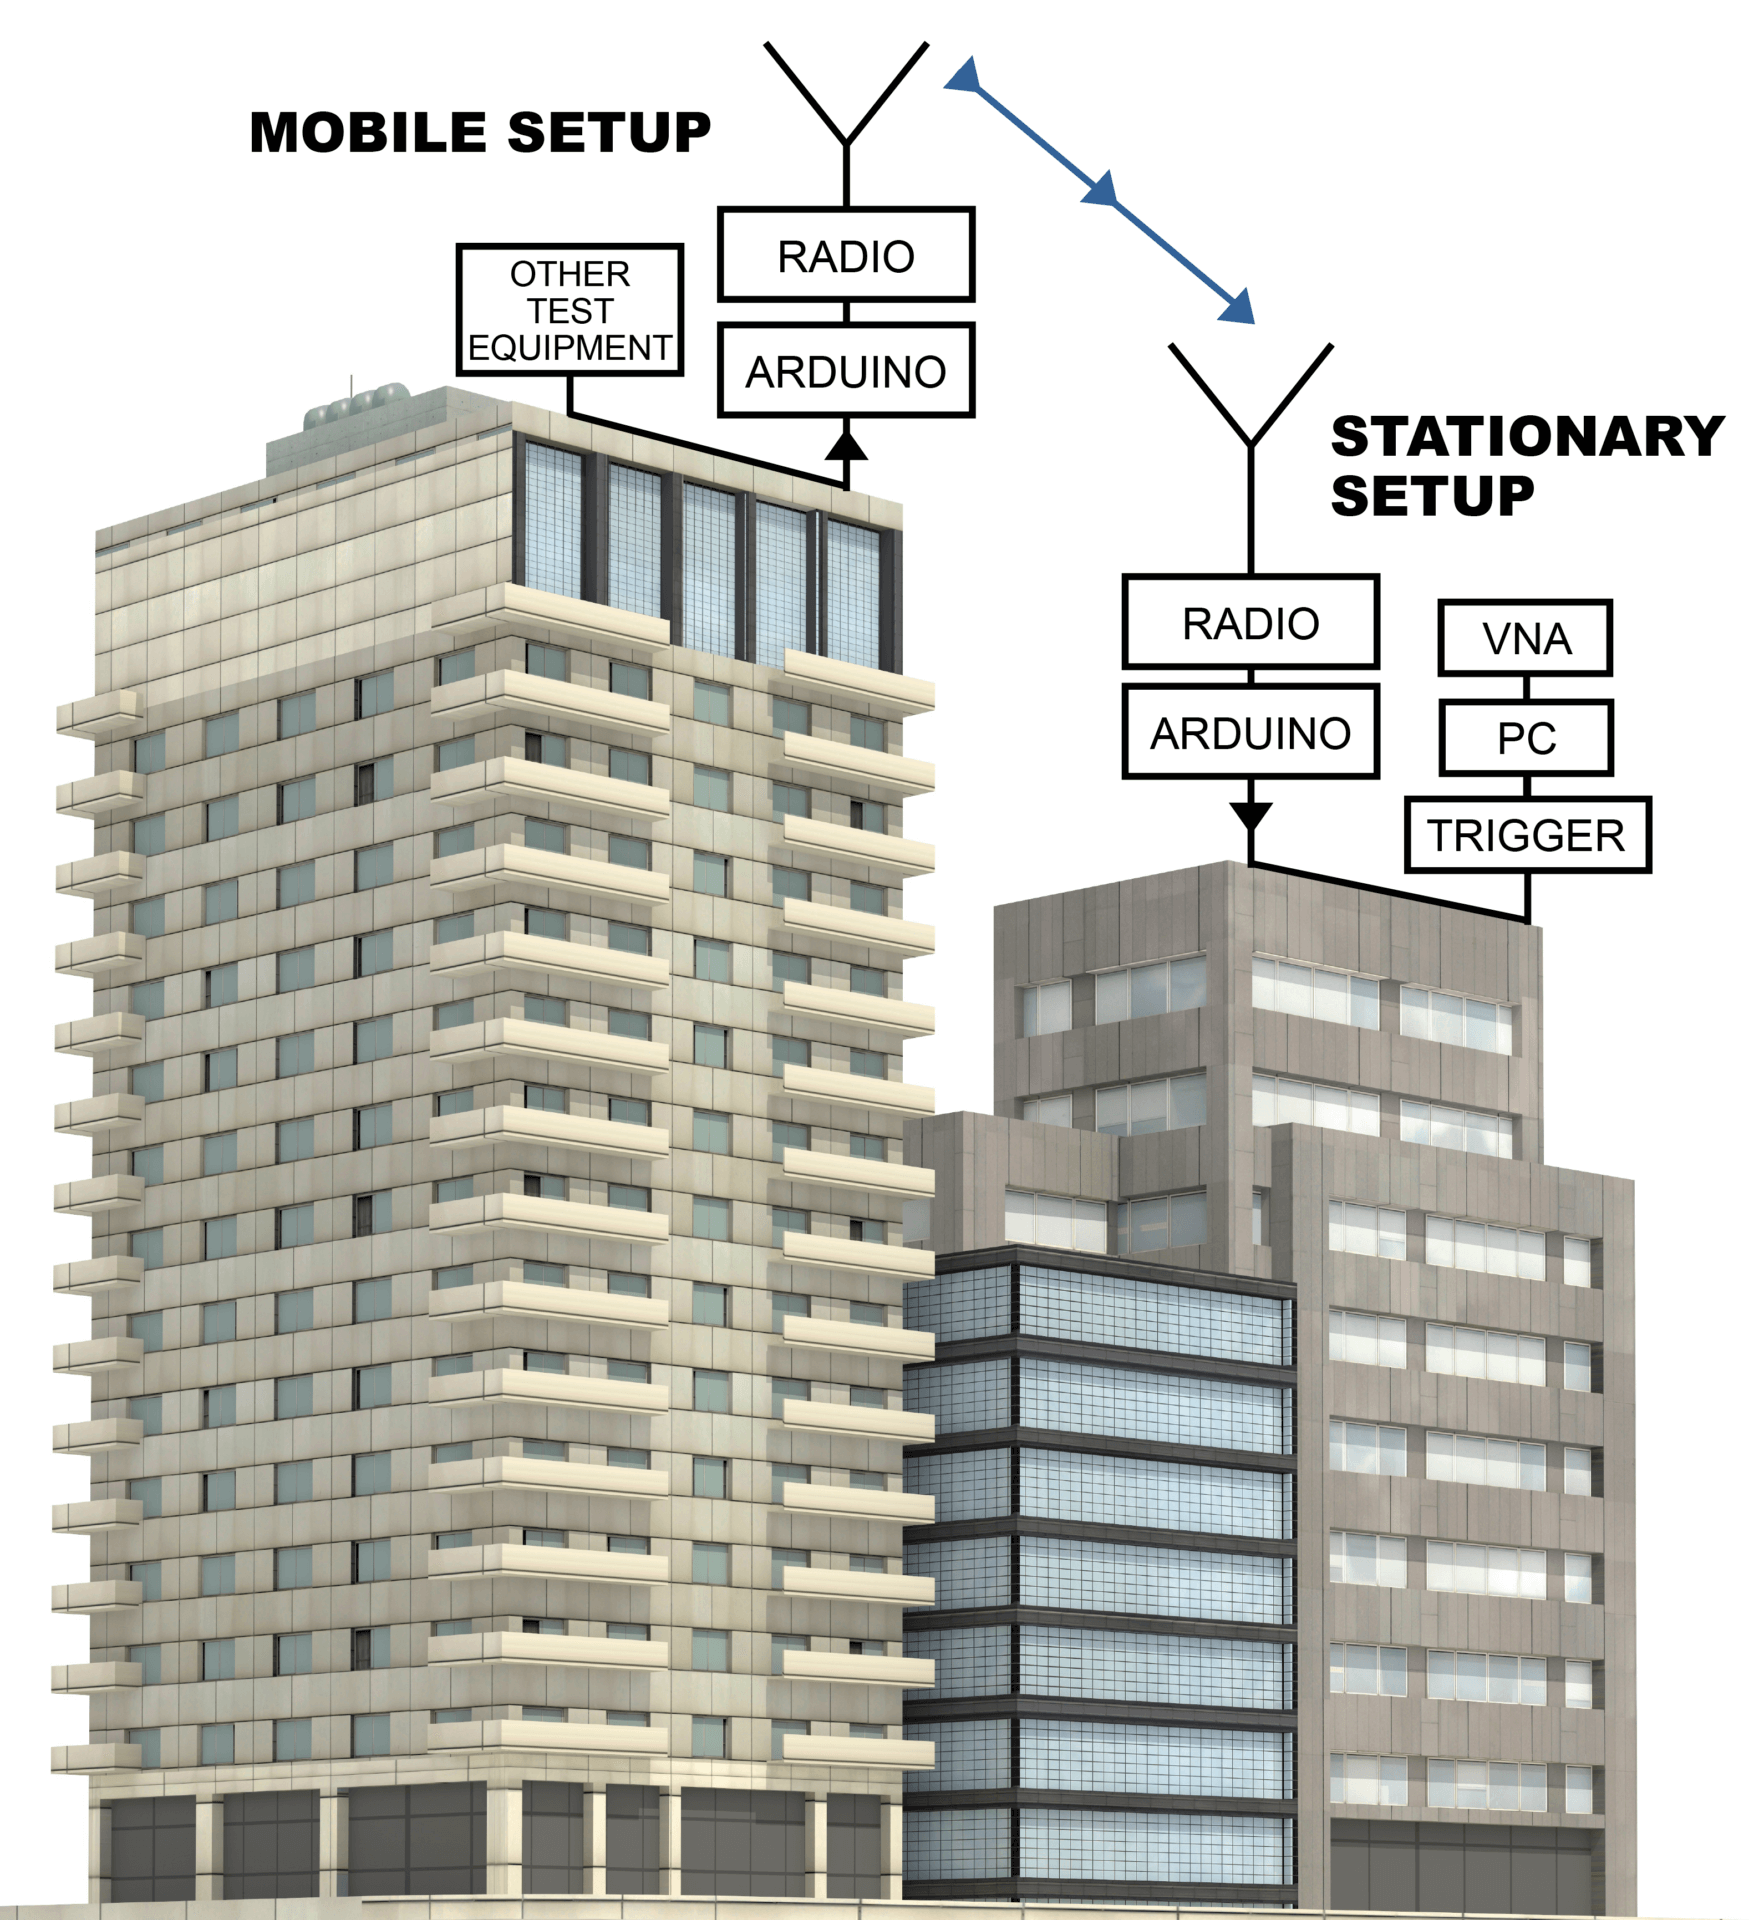
A Long-Range Solution For Triggering Analyzers with Arduino Microcontrollers
July 15, 2022
Remote measurements using VNAs are becoming an increasingly popular method due to the increased portability of USB vector network analyzers. For applications such as far-field antenna measurement setup and using a VNA as an insertable remote sensor, the ability to remotely control the VNA becomes imperative. Read the application note to learn about a cost-effective solution for such measurements.
Balun Measurements with a 2-port Vector Network Analyzer
July 14, 2022
Balanced measurements are necessary for a number of applications. High-speed digital transmission lines are often employed on printed circuit boards (PCBs) to transport signals with extremely high bandwidths. It is important to be able to verify insertion loss, characteristic impedance, phase imbalance, and crosstalk to adjacent conductors. Antennas are sometimes fed with balanced lines as well and being able to verify the return loss or VSWR of the balanced feed plus antenna combination is useful.
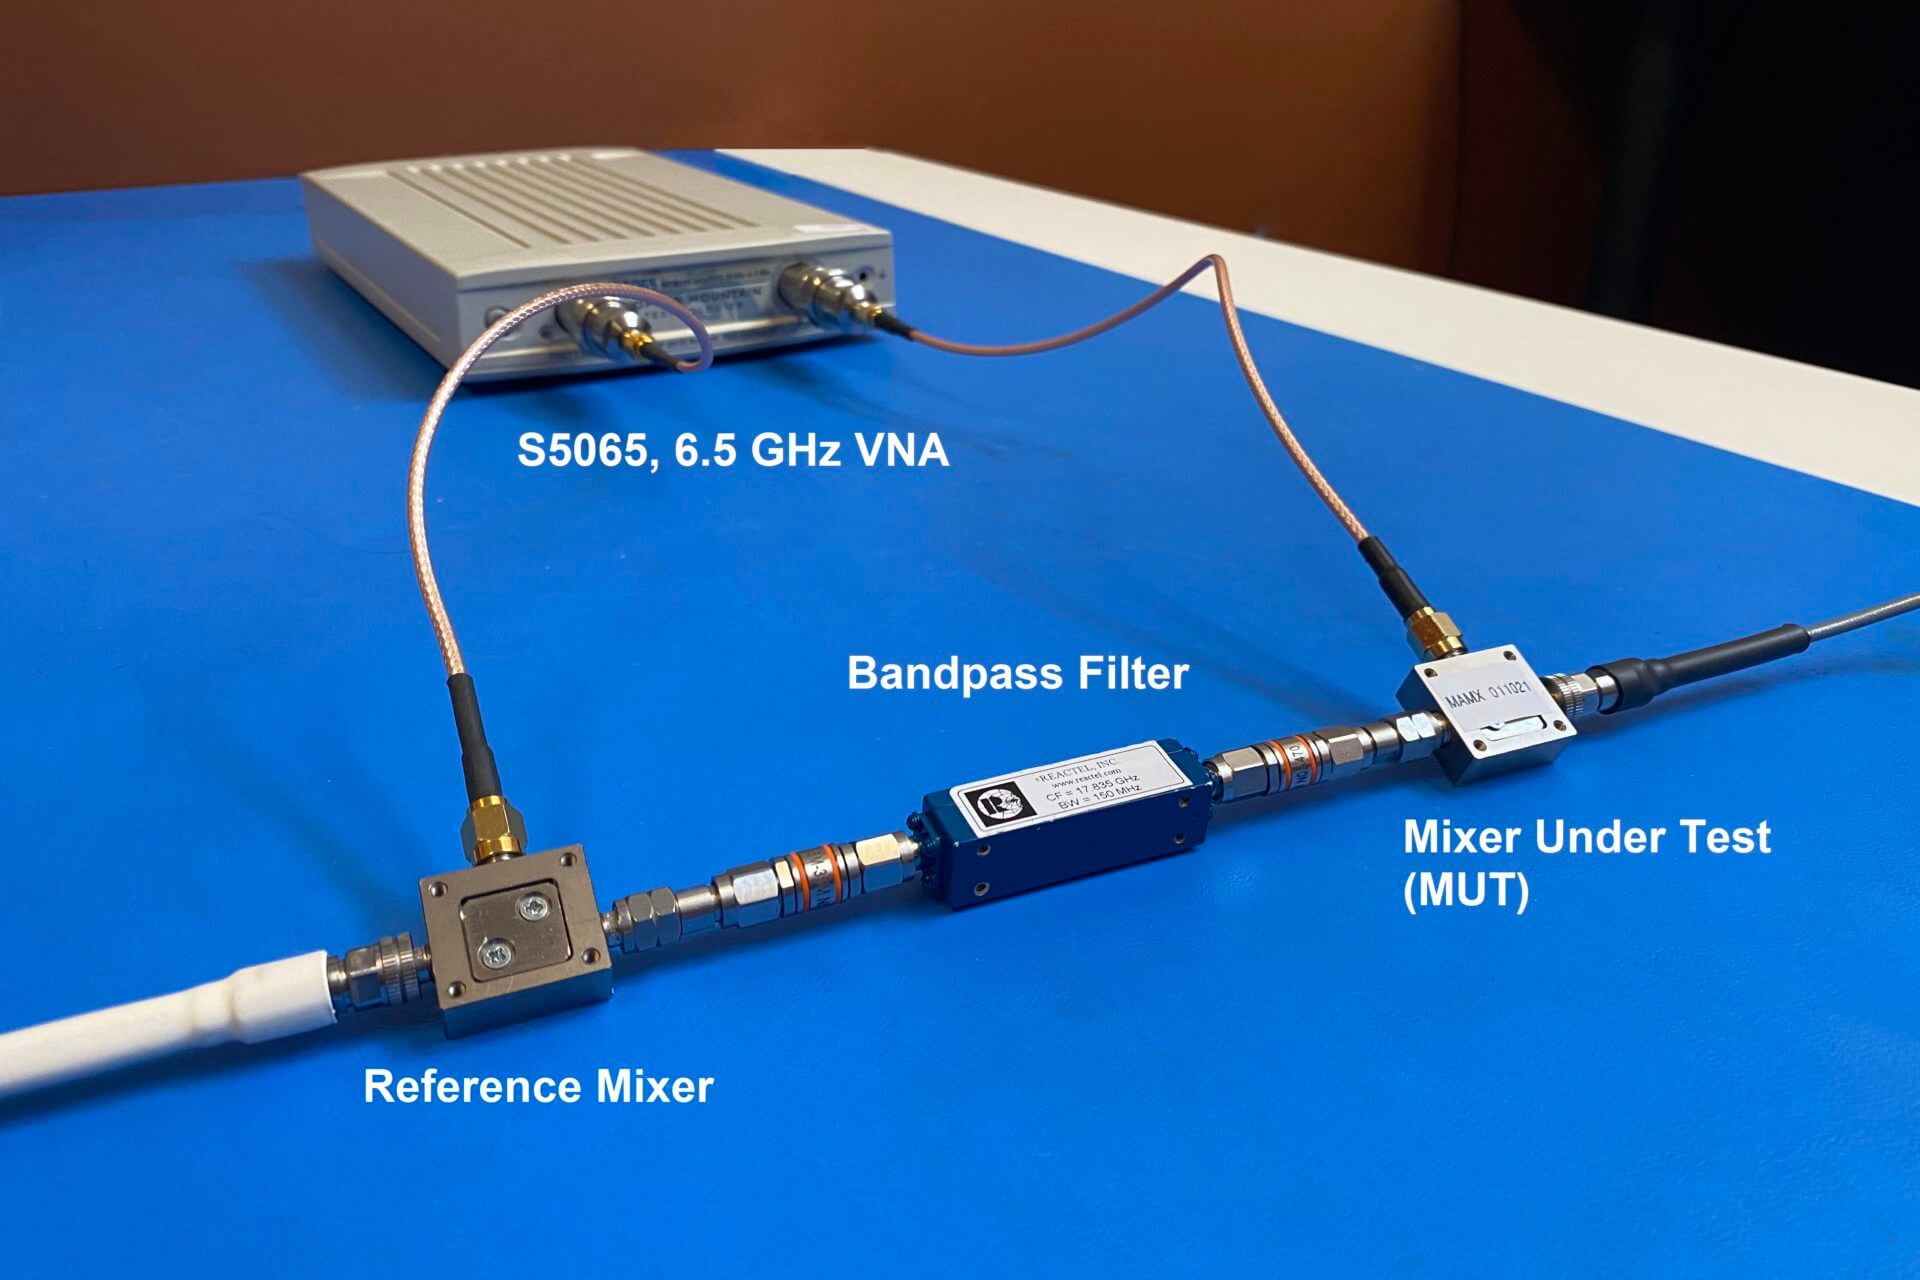
mmWave Mixer Measurements with a Low Frequency VNA
April 25, 2022
It is important to use the right equipment for the right measurement to get results that are accurate. Precision millimeter-wave (mmWave) measurements normally require a VNA with built-in capability or mmWave extenders to augment the frequency range. This equipment may be used to evaluate mmWave mixers which are commonly used to up-convert or down-convert 5G signals back and forth from baseband frequencies.

Automation Guide for CMT VNAs
September 23, 2021
There are two methods for automating CMT VNAs. One is using SCPI commands and the other is using COM (Component Object Model) functions.
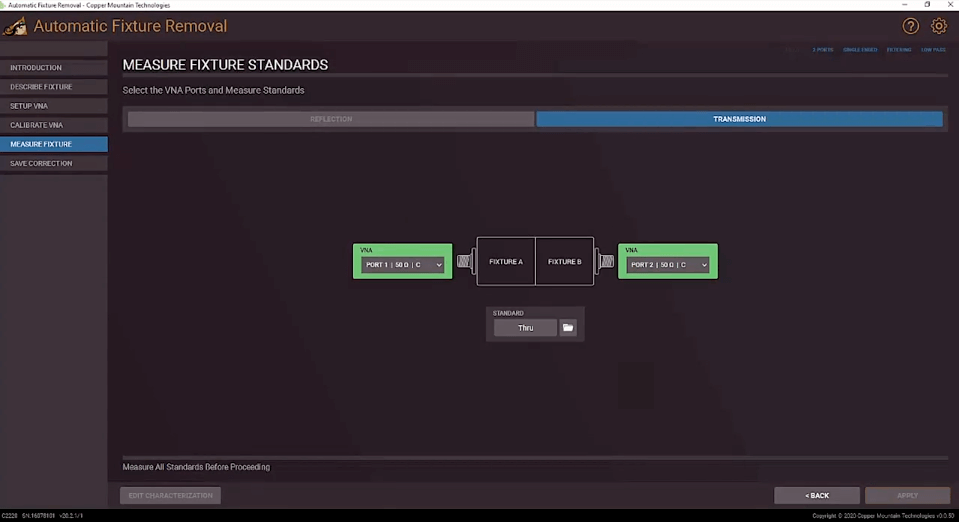
Automatic Fixture Removal Plug-in Method Selection
August 5, 2020
Automatic Fixture Removal (AFR) plug-in serves to simplify a device under test (DUT) measurement process based on a Vector Network Analyzer (VNA) when direct access to DUT is not possible. A principal challenge in these cases is correct elimination of fixture effects.