Passive RF System Measurements in a Strong RF Environment: Using an Amplifier with a 2-Port VNA
April 19, 2018
Overview
It is sometimes necessary to evaluate passive RF systems in environments where there is significant ingress from other sources. The most common cases are antenna system measurements at community transmitter sites. If there is sufficient RF present in the near field, the antenna being tested doesn’t even need to be particularly broadband for problems to arise.
Vector network analyzers are sensitive instruments, typically operated at very low signal levels. Ingress from local sources can skew measurements, and if the ingress is strong enough the analyzer can be damaged. Coordinating multiple station sign-offs can be difficult, if not impossible. When working with broadband antennas in a large market, the interferer doesn’t even need to be collocated to impact the measurements. With another repacking of broadcast spectrum looming, the congestion will only get worse.
One common technique for overcoming local ingress involves employing a broadband amplifier to raise the test signal well above the noise floor. With two-port VNAs, where direct receiver access is not possible, calibration becomes challenging. Normalization techniques described in my earlier paper worked well for low-band VHF and FM in-band measurements, as well as broad-band time domain measurements regardless of the operating frequency. However, the method breaks down quickly when making in-band measurements in the upper VHF band, and to a greater extent in the UHF band. The normalization method described in this paper present data that more closely resemble that collected by the VNA without the use of an amplifier.
Equipment
I used a Copper Mountain Technologies S5048 Compact vector network analyzer for the lab tests presented in this document. In addition to the analyzer, a high gain, broadband amplifier is required. The CMT analyzer has a maximum output of +5 dBm, so the amplifier should be able to produce several watts output with less than 3 mW input. I use a Mini-Circuits model ZHL20W-13+ amplifier. This amplifier can supply up to 20-watts output at its maximum -3 dBm input. The amplifier should be operated well below its maximum output in order to maintain a stable output. If variations in output occur after the test configuration has been calibrated, the data will be skewed.
While one must be careful not to overdrive the amplifier, it is an excellent choice for this application, as according to its datasheet, the amplifier can survive transmitting into a short or open at quarter power. As good engineering practice dictates trying to avoid such situations, I always have at least a 3 dB pad on the amplifier’s output, and in most cases use a 10 dB pad. By adding a 3 dB (or larger) pad on its output, I can safely operate at half-power into and open or short. In addition to the amplifier, I use a Narda directional coupler and a variety of fixed attenuators.
Directional Coupler & Load Measurements
The maximum return loss that can be evaluated accurately is limited by the directivity of the directional coupler, and the return loss of the load used for isolation calibration. If you wish your measurements to be accurate to 1.02:1, the coupler’s directivity must be greater than 40 Db in the frequency range(s) of interest. The load used for isolation calibration should be on the order of 40 dB return loss or greater. The plots on page 5 show my coupler’s directivity across the UHF and VHF television bands. The plot on page 6 show the load’s return loss across the same frequency range. If you do not have a high power load of sufficient return loss, it is best to omit the isolation calibration. A table showing VSWR versus return loss is provided on page 10 to provide additional clarification.
Determining Power, Pad and Load Values
It is desirable (but not mandatory) to have a spectrum analyzer to determine the minimum power required to overcome local interference. The Mini-Circuits amplifier detailed above has a typical gain of roughly 46 dB from 20 MHz to 1,000 MHz, and can produce +43 dBm (20W) at 3 dB compression, with – 3dBm input power. The Copper Mountain Technologies S5048’s default source power is 0 dBm, which is more than the amplifier can tolerate at its input, so I always use a pad on the input to the amplifier as an extra measure of caution (pad 1 in the drawings on page 7). Since the analyzer’s maximum output is +5 dBm, I selected an 8 dB pad to assure I will never apply more than -3 dBm to the amplifier’s input. That being said, I normally operate the VNA at 0 dBm output, and never exceed +2 dBm output. With the 8 dB pad between the network analyzer and the amplifier input, this sets the amplifier’s output to between 6.3 watts and 10 watts. With a 3 dB pad between the amplifier and the directional coupler (pad 3 in the drawing on page 7), I can apply up to 5 watts to the DUT. If more than 5 watts is required for testing, it is time to start turning off some transmitters!
Any network analyzer will incur damage if presented excessive input levels, so one also needs to be careful to add a significant amount of attenuation between the directional coupler sample and the analyzer’s input to avoid overloading the instrument. Input limitations for analyzers vary, so refer to the manufacturer’s specifications to select the appropriate attenuation. The input to port 2 will require an attenuator to avoid overloading the receiver. The value of this attenuator will vary with the output power of the amplifier and the coupling of the sample port. In the case of my test configuration, the maximum possible at the sample port is +10 dBm. The amplifier’s maximum output is 20 watts (43 dBm), and I use at least a 3 dB pad on its output. Therefore, the input to the directional coupler is a maximum of 10 watts (40 dBm). The sample is -20 dB at UHF, so the maximum possible power at this port would be 20 dBm. I always use at least a 10 dB pad on the input to port 2, which in this worst case scenario would present +10 dBm to port 2. Since my normal operating power is 3 dB or more below the amplifier’s maximum, I am well within the instrument’s tolerance when using the 10 dB pad. For simplicity, cable losses were ignored in the previous example, so the power present at port 2 is actually somewhat less.
The previous example showed the maximum powers available. In most cases, I use a 10 dB, 20- watt attenuator on the output of the amplifier (pad 3 in the drawings on page 7) in order to protect it from damage during calibration, or due to excessive reflected power in a severely damaged system. Operating the analyzer at its default 0 dBm output, the input to the directional coupler will be roughly +28 dBm (0.63 watt), and increasing the analyzer output to +2 dB allows me to apply 1 watt to the DUT. A reminder that the attenuator on the amplifier output needs to be able to tolerate at least a 20-watts in the event the amplifier is accidentally operated at its maximum output.
Connection, Calibration and Measurement
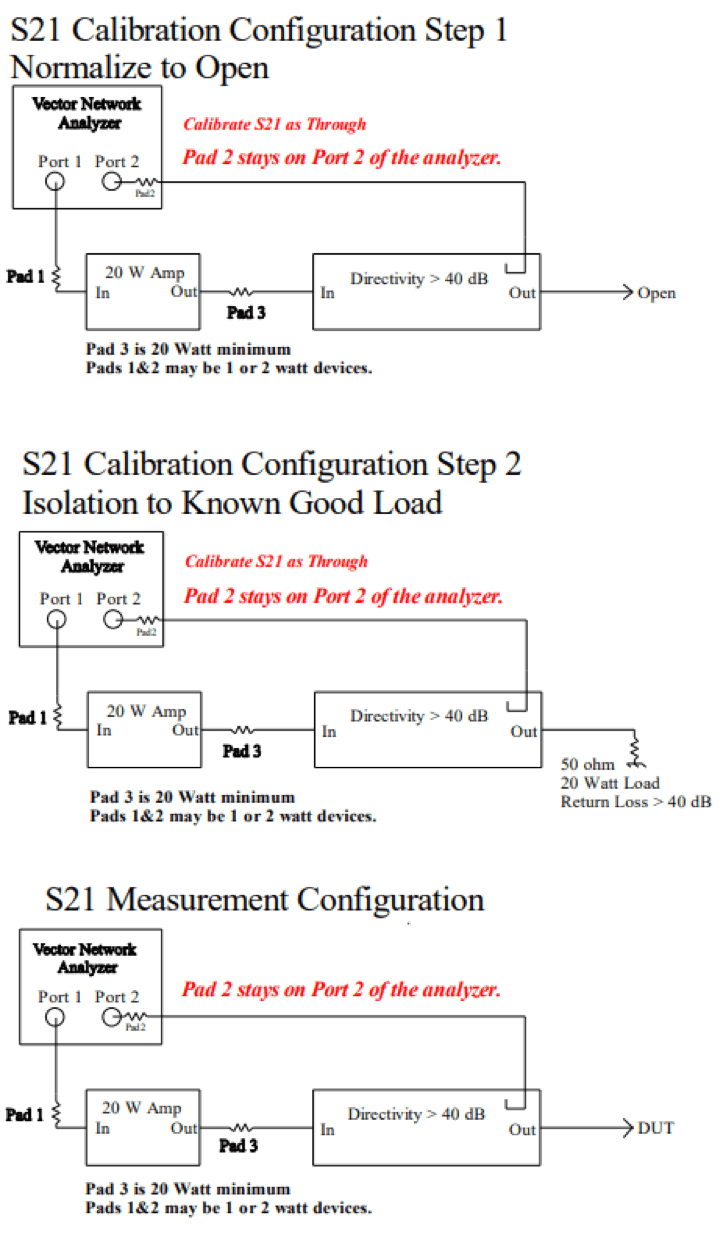
All measurements are S21 (transmission loss). The normal calibration standards are not used in this configuration. Note: as opposed to the method suggested in my original paper, a bidirectional coupler is not required.
Connect the equipment as shown at the top of page 7 to calibrate transmission loss. **I recommended turning the amplifier off when connecting or disconnecting the load or DUT to avoid damage to the connectors. Set the instrument to measure S21. Normalize through loss from the coupler input to the reverse sample with the coupler’s output open. Once the through loss is normalized, connect a resistive load having a return loss greater than the desired system return loss to the output of the directional coupler and calibrate isolation. If a high-quality resistive load is not available, do NOT perform the isolation calibration. Apply the corrections. Connect the directional coupler directly to the device under test (DUT) as shown at the bottom of page 6 to measure system return loss.
While these are S21 measurements, you can use any of the formats normally at your disposal for S11 measurements. There are some things to keep in mind. First, the accuracy of the measurements will be limited by the quality of the directional coupler. Do not cut corners on the directional coupler or load used for isolation calibration. Depending on the system specification, directivity/return loss on the order of 37 dB or higher is recommended to produce meaningful data. I prefer both in the range of 40 dB, as all my adapters, and other devices are better than 1.02:1 VSWR (40 dB return loss).
You will need to correct time domain measurements, as the instrument will not automatically perform the math in S21 mode. I typically multiply time domain results by half the system velocity factor to yield correct time and distance to fault.
Lab Experiments
In order to ascertain the difference between measurements with and without the external amplifier, I made reflection measurements of a rough-tuned low power mask filter. I calibrated the Copper Mountain Technologies S5048 network analyzer using an electronic calibration kit. In order to maintain consistency, I terminated the output of the filter with the same 50 Ω load that will be used for the amplified measurements. I saved the S11 data to a Touchstone data file. I then configured the equipment for amplified measurements as described above. This time S21 data was stored to a Touchstone file.
For comparison purposes, the S11 data recorded without an amplifier was loaded to the software’s S-parameters. The S21 data collected using an external amplifier and directional coupler, calibrated as described in this paper was loaded to memory. The plots on pages 8 through 10 show there are only subtle differences between the amplified and non-amplified plots using this improved normalization technique. The blue trace in the plots represents data collected without the amplifier, and the red trace represents data collected with the external amplifier and directional coupler.
Final Notes
Measurements are more accurate when the analyzer can be used with its calibrated internal couplers, so I prefer to make measurements without the use of external amplifiers and couplers. That being said, there are times an amplifier must be used to acquire data.
While it may have been easier to just suggest fixed operating conditions for a “one size fits all” solution, I wanted to demonstrate the thought process in selecting the appropriate pad(s) and operating power. A solid state amplifier’s output can vary with temperature, and a variation in the source power will lead to errors in the measurement. Since operating the amplifier at higher output power increases its temperature, I prefer to use the minimum amount of amplification required to overcome the noise floor.
Again, a big thank-you to the folks at Copper Mountain Technologies for their input, and continued willingness to attend to their customer’s needs.
Narda Directivity & Return Loss across UHF Band (14-51)
Narda Directivity & Return Loss across VHF Band (2-13)
In both 21 plots, the red trace is the coupling reference, and the blue trace is the reverse measurement. The difference between the traces is the directivity.
Load Return Loss from 50 MHz to 806 MHz
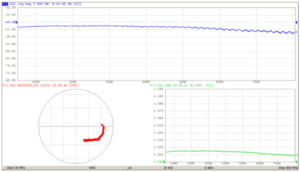
Polar Display of System Impedance across 20 MHz using New Calibration Method
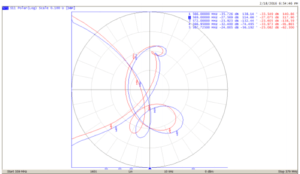
The blue trace is data collected using the network analyzer without an external amplifier, and the analyzer was calibrated using an electronic calibration kit. The red trace is data collected with the external amplifier and directional coupler, and the test system was calibrated.
System Return Loss across 20 MHz using New Calibration Method
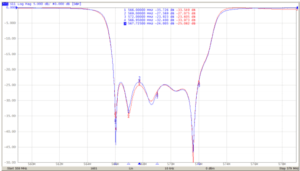
The blue trace is data collected using the network analyzer without an external amplifier, and the analyzer was calibrated using an electronic calibration kit.
The red trace is data collected with the external amplifier and directional coupler, and the test system was calibrated.
System VSWR across 20 MHz using New Calibration Method
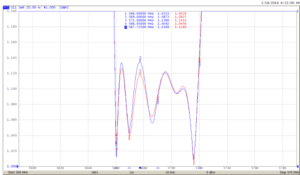
The blue trace is data collected using the network analyzer without an external amplifier, and the analyzer was calibrated using an electronic calibration kit.
The red trace is data collected with the external amplifier and directional coupler, and the test system was calibrated.