


Evaluating True VNA Performance: Metrology-Grade vs. Non-Metrology VNAs
May 14, 2026A VNA data sheet typically highlights a small set of headline specifications such as dynamic range, output power, and sweep speed. While these metrics are useful, they do not always provide a complete picture of VNA performance and how the instrument will behave in demanding measurement applications.
This article examines several performance characteristics that are either not specified directly or are only partially represented by common data sheet parameters. Particular attention is given to dynamic range, where a single “typical” number can obscure significant variation over frequency and does not convey the confidence level associated with the specification.
In practice, engineering teams evaluating a VNA are operating under real constraints. A startup preparing its first prototype, a university lab stretching limited funding, or a manufacturing group under pressure to reduce test costs may naturally gravitate toward lower-priced instruments. Preserving capital is important to any organization, but it is important to be aware of the trade-offs. Some equipment might have attractive pricing but may be unsuitable for use in the lab. An organization might favor the acquisition of an inexpensive piece of test equipment. The decision is understandable. Budget limitations, compressed development schedules, limited metrology expertise, distributed engineering teams, and pressure to accelerate time-to-market all push organizations toward solutions that appear to offer acceptable performance at a lower upfront cost. The challenge is that the true cost of a VNA is rarely captured by the purchase price alone.
Measurement uncertainty, calibration stability, instrument drift, receiver linearity, unit-to-unit variation, and long-term repeatability can become significant pain points once the instrument moves from basic demonstrations into real environment: design validation, troubleshooting, compliance work, or production testing.
At that stage, subtle performance limitations can begin to affect engineering confidence. Engineers may spend additional time investigating whether unexpected results originate from the device under test or from the measurement system itself. In manufacturing environments, these uncertainties can contribute to false failures, escaped defects, increased rework, and inconsistent quality outcomes. This raises an important question: when measurement confidence directly impacts product quality and development efficiency, is the lower-cost instrument actually the lower-cost solution?
To examine this question in practical terms, we performed an in-depth comparative analysis between the Copper Mountain Technologies SC0902 and a budget-priced benchtop VNA from a well-known supplier whose measured performance suggests that it does not deliver the accuracy and uncertainty level expected of a metrology-grade instrument. In addition to dynamic range versus frequency, we examine receiver linearity and normalization stability. These second-order effects are rarely emphasized in data sheets, yet they determine whether a calibration remains valid and whether the resulting S-parameter data can be trusted.
Data Sheet Specifications
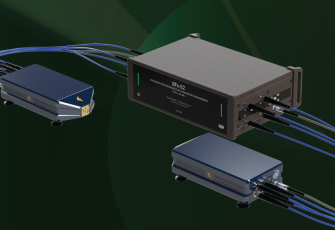
The SC0902 is a general-purpose, mid-frequency 9 GHz vector network analyzer capable of full two-port S-parameter characterization across a broad frequency span, with flexible sweep modes including linear, logarithmic, segmented, and power sweeps. Its performance is framed around high dynamic range and fast measurement throughput, supported by a wide IF bandwidth selection and high point counts for detailed spectral resolution. The source offers a controllable output power range suitable for both small-signal and moderate drive measurements, while the receiver system is characterized in terms of low noise, stable trace behavior, and well-defined measurement accuracy across transmission and reflection conditions. After calibration, the instrument achieves strong system-level error correction, with solid directivity, match, and tracking performance that underpin reliable measurements. The architecture is host-controlled via USB, emphasizing flexibility, automation, and ease of integration, with standard reference connectivity and operating characteristics suitable for both laboratory and production environments.
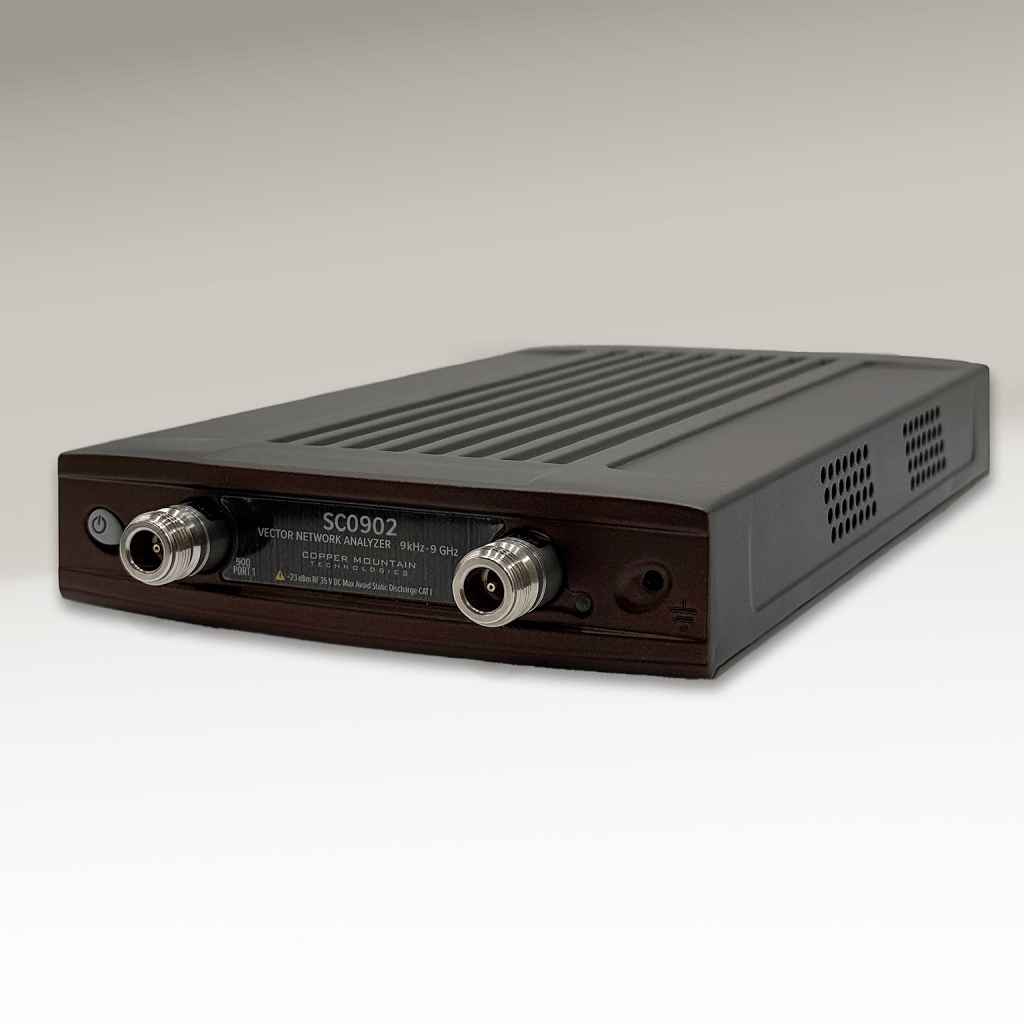
Figure 1 – Copper Mountain Technologies SC0902 VNA
Comparing Performance Metrics
Dynamic Range is specified on the data sheets but it is very common to see degradation at the low and high end of the frequency range. Here, the comparison VNA exhibits extremely poor dynamic range below 1 MHz.
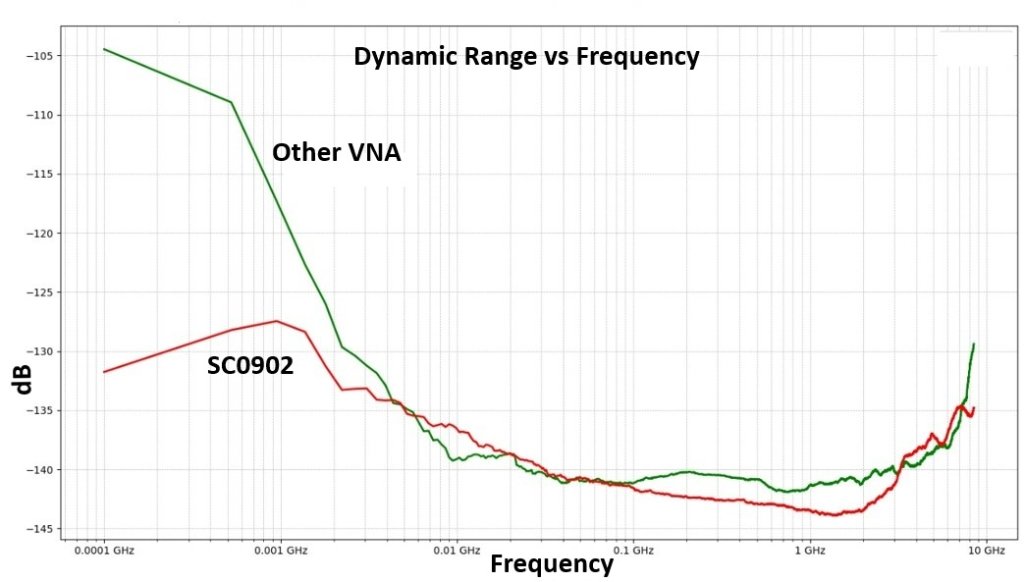
Figure 2 – Dynamic Range vs Frequency
The comparison VNA is specified with a typical dynamic range of 125 dB. By comparison, the Copper Mountain Technologies SC0902 provides the following guaranteed dynamic range performance:
- 95 dB from 9 kHz to 100 kHz
- 115 dB from 100 kHz to 10 MHz
- 130 dB from 10 MHz to 4.5 GHz
- 125 dB from 4.5 GHz to 6.5 GHz
- 120 dB from 6.5 GHz to 9 GHz
These are guaranteed specifications, not typical values. Each instrument is production-tested, and the published limits are supported with a 2σ confidence level.
Dynamic range is defined as the difference between the maximum available source power and the receiver noise floor, referenced to a 10 Hz IF bandwidth. It establishes the maximum attenuation or isolation that can be measured before receiver noise dominates the result.
Measurements of low-loss devices are generally straightforward because the signal arriving at the receiver remains far above the noise floor. The real challenge arises when measuring very small signals, such as the stopband rejection of a high-performance filter or the isolation between two ports.
For example, if a VNA delivers +10 dBm of source power and the receiver noise floor is -120 dBm in a 10 Hz IF bandwidth, the instrument has a dynamic range of 130 dB. However, this does not mean that a 130 dB attenuation measurement will be accurate.
Because a VNA measures complex I/Q vectors, uncertainty near the noise floor is governed by Rayleigh statistics. As the received signal approaches the noise level, both magnitude and phase uncertainty increase rapidly. A practical engineering rule of thumb is that the signal entering the VNA receiver after passing through the DUT should remain at least 10 dB above the measurement noise floor to maintain acceptable uncertainty.
Using this criterion, a VNA with +10 dBm source power and a -120 dBm receiver noise floor can make attenuation or isolation measurements up to approximately 120 dB with reasonable confidence.
If additional sensitivity is required, two approaches are available:
- Increase the source power. Raising the stimulus level from 0 dBm to +10 dBm improves the signal-to-noise ratio by 10 dB, effectively lowering the displayed noise floor by 10 dB. (0 dBm is the default stimulus power of the VNA)
- Reduce the IF bandwidth. Narrowing the IF bandwidth by a factor of 10 reduces the receiver noise floor by approximately 10 dB, at the expense of a longer sweep time.
- Introduce averaging. Averaging has an effect which is equivalent to narrowing the IF measurement bandwidth. 10x averaging will reduce the effective noise floor by 10 dB and increase measurement time by 10x.
These three adjustments are essentially equivalent in terms of improving measurement sensitivity.
Dynamic range is specified in a 10 Hz IF bandwidth because this has become the industry-standard compromise between sensitivity and sweep speed. Although a 1 Hz IF bandwidth can provide approximately 10 dB additional dynamic range, it also increases sweep time by roughly a factor of ten, making it impractical for many routine measurements.
In summary, dynamic range defines the span between the highest available stimulus level and the receiver noise floor. It determines how deeply into the stopband or isolation region a VNA can measure while maintaining useful accuracy. As a practical guideline, the signal entering the VNA receiver should remain at least 10 dB above the noise floor to ensure reliable vector measurements. The chart shows that the SC0902 exhibits superior dynamic range over almost all frequencies.
Receiver Linearity
Receiver linearity is rarely called out explicitly on a VNA data sheet, but it has a direct impact on S-parameter accuracy over a wide range of signal levels. During calibration, the VNA characterizes the gain and phase response of its receiver channels at a particular signal level, typically with source power between -10 and 0 dBm. The calibration process assumes that the relative gain and phase of the receivers remain constant as input levels vary.
If the receivers are not linear, this assumption breaks down. The result is measurement error whenever the signal entering the receiver differs significantly from the level present during calibration.
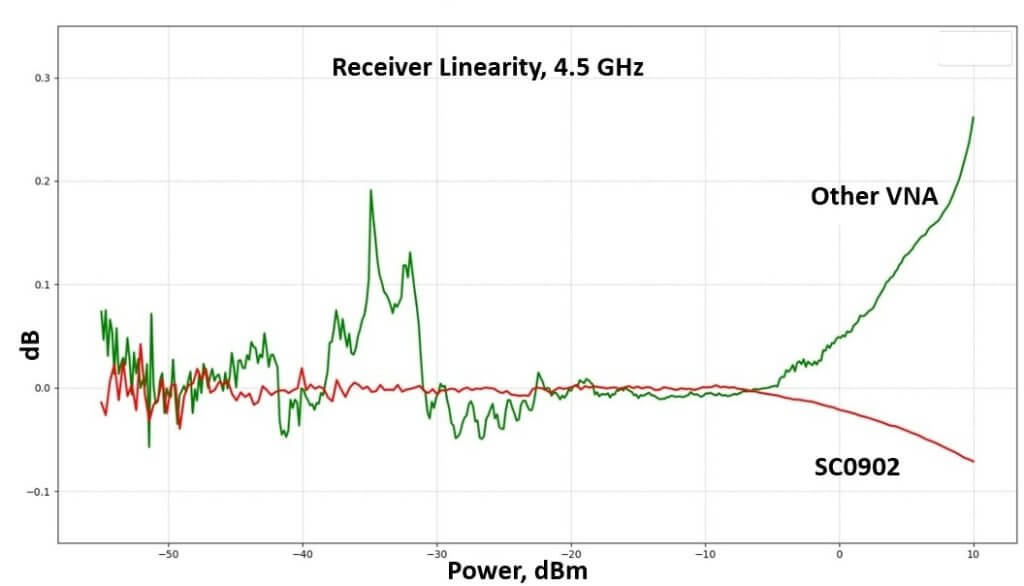
Figure 3 – Receiver Linearity
Why is VNA Receiver Linearity Important?
A vector network analyzer is typically calibrated at a relatively high source power level, commonly between -10 dBm and 0 dBm. At these signal levels, the instrument’s systematic errors, such as directivity, source match, and reflection tracking, are characterized and mathematically removed. As a result, the VNA can deliver highly accurate S-parameter measurements under conditions similar to those used during calibration.
Because S-parameter measurements are ratio-based, absolute signal amplitude is not inherently important. For example, in a reflection measurement, the VNA computes:
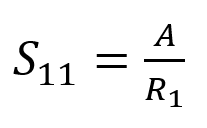
Changing Stimulus Output Power After Normalization
where R1 is the incident wave measured by the reference receiver, and A is the reflected wave measured by the port 1 test receiver. If the source power changes, both signals scale together, and the ratio remains constant, provided the two receiver channels maintain perfectly linear gain.
This assumption of receiver linearity is fundamental. Calibration compensates for fixed gain and phase differences between receiver channels, but it cannot correct for gain compression, expansion, or other nonlinear behavior that occurs as signal levels vary. If the relative gain of the receivers changes with input power, the measured ratio no longer accurately represents the true S-parameter.
This limitation becomes particularly important when measuring devices with large insertion loss or high isolation. For example, a filter with 40 dB of rejection will produce receiver signals about 40 dB lower than the levels present during calibration. If the VNA receivers exhibit poor linearity at these lower signal levels, substantial amplitude and phase errors can result.
Testing has shown that the referenced comparison VNA begins to exhibit significant nonlinearity when receiver input levels fall into the -30 dBm to -40 dBm range. Under these conditions, measurements of high-rejection filters, attenuators, or weak reflections can be highly inaccurate. In practical terms, this means that a device expected to provide 30 to 40 dB of attenuation may not be measured with sufficient confidence to support engineering decisions.
In short, receiver linearity determines whether calibration remains valid over the full range of signal levels encountered during real-world measurements. Without good linearity, the VNA may appear accurate near the calibration level but produce increasingly unreliable results as measured signals become weaker or stronger.
In the next two experiments, the SC0902 and the comparison VNA were configured to measure S21 and S12 with a precision thru connecting the two ports. The stimulus power was initially set to -30 dBm, and each trace was normalized to 0 dB. The source power was then reduced to -40 dBm. In a second experiment, S21 and S12 are normalized at -40 dBm and measured at -50 dBm.
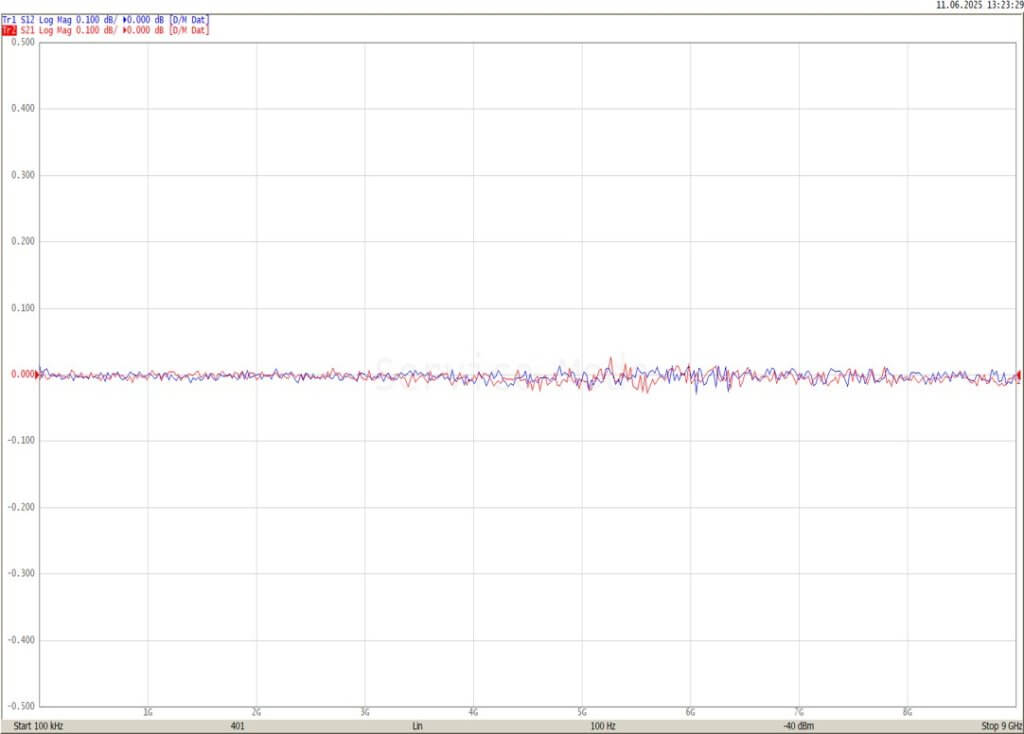
Figure 4 – SC0902 Normalized at -30 then Measured at -40 dBm Stimulus
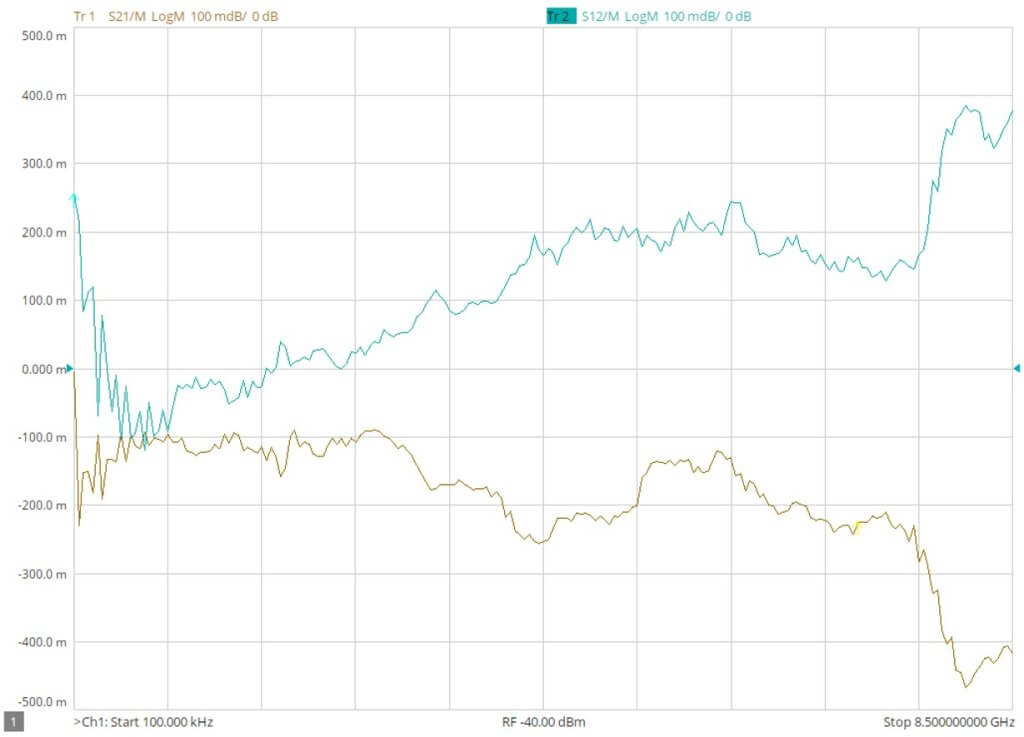
Figure 5 – Comparison VNA Normalized at -30 then Measured at -40 dBm Stimulus
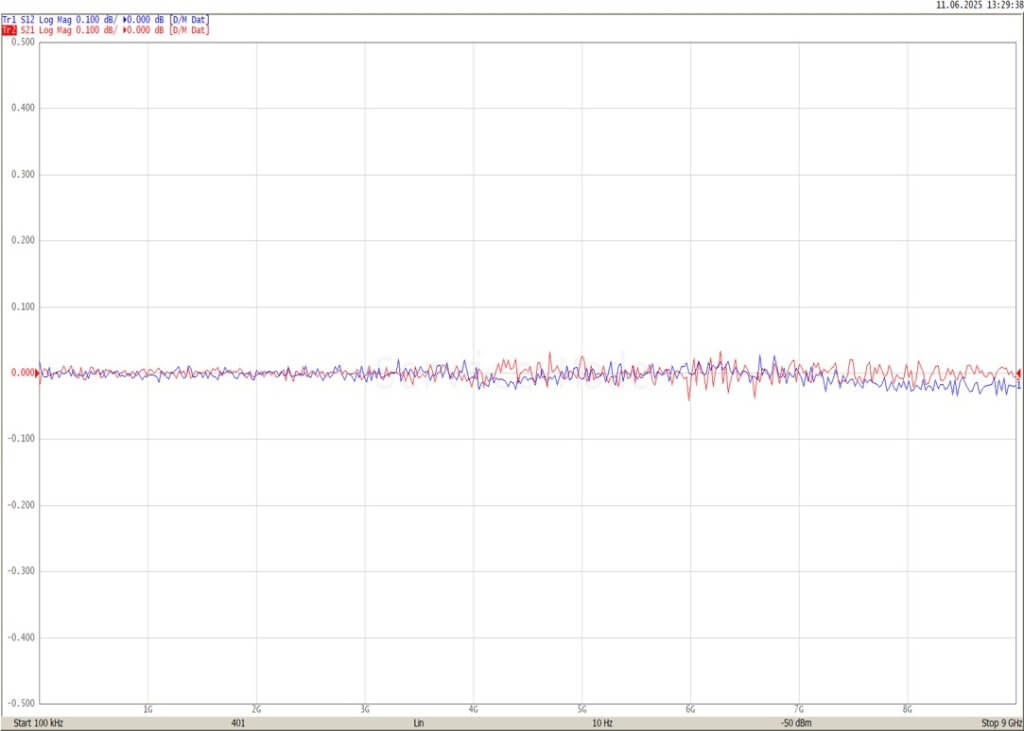
Figure 6 – SC0902 Normalized at -40 then Measured at -50 dBm Stimulus
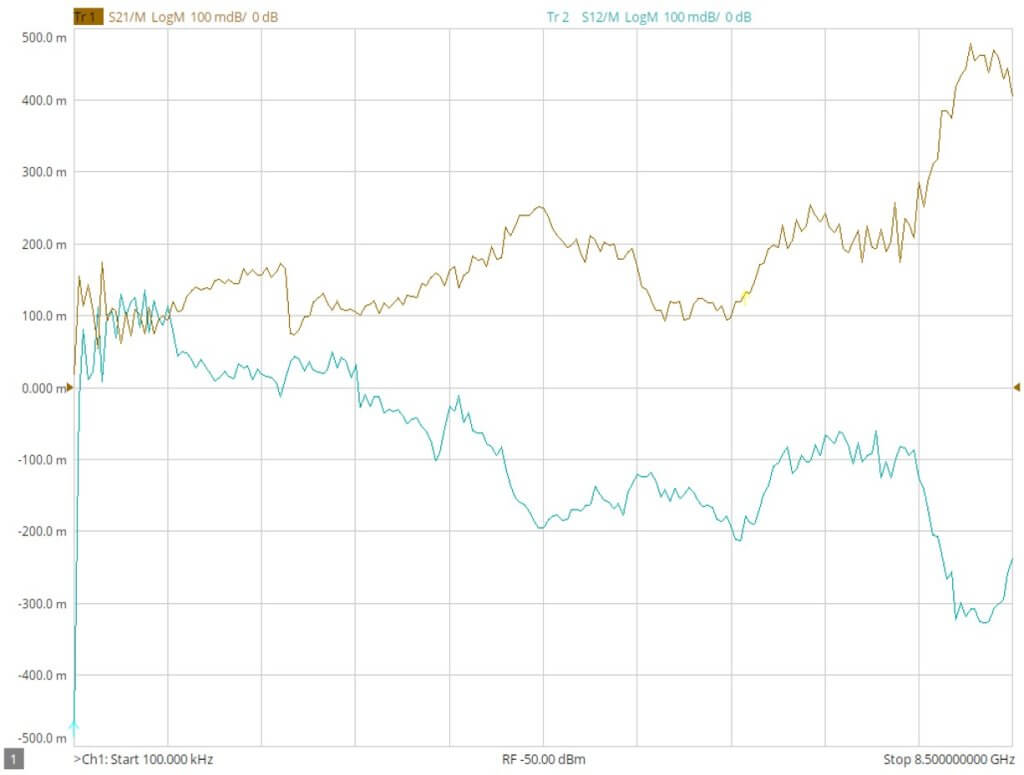
Figure 7 – Comparison VNA Normalized at -40 then Measured at -50 dBm Stimulus
This is exceptionally poor performance.
Normalization is a simplified calibration that removes the frequency response of the transmission path. In terms of the 12-term error model, normalization corrects the transmission tracking term. As stated previously, after normalization, a change in source power should not materially affect the measured response, because both the reference and test receiver signals decrease by the same amount, and their ratio should remain constant.
If the displayed transmission changes significantly after a 10 dB reduction in source power, the implication is serious. It indicates that the relative gain and phase response of the receiver channels is not constant with signal level. In that case, the transmission tracking term determined during normalization is no longer valid.
This is more than a cosmetic defect. Full two-port calibration also relies on the assumption that the receiver transfer functions remain invariant over the range of signal levels encountered during measurement. If the instrument cannot maintain a normalized thru response over a modest 10 dB change in source power, then the broader calibration model cannot be relied upon to remove systematic errors accurately over any range.
The SC0902 remains essentially flat after the 10 dB power reduction, demonstrating excellent receiver linearity and calibration stability. The comparison VNA exhibits approximately 0.5 dB of error, confirming that the receiver response changes with signal level and casting doubt on the validity of any calibration performed on the instrument.
Key Take Away
If measurement confidence is critical to your organization, investing in a metrology-grade VNA from an established manufacturer can significantly reduce risk in both development and production environments. While lower-cost instruments may appear competitive on paper, limitations in calibration stability, receiver linearity, dynamic range, traceability, and long-term repeatability can introduce uncertainty into measurement results. These issues can ultimately affect product quality, increase troubleshooting time, complicate compliance testing, and erode customer confidence in your brand.
Copper Mountain Technologies VNAs are designed for engineers who require reliable, traceable, and repeatable measurements. Every instrument is calibrated in ISO/IEC 17025-accredited laboratories, with measurement uncertainties traceable to the National Institute of Standards and Technology (NIST). This ensures that published specifications are not merely aspirational, but are backed by rigorous production testing and internationally recognized calibration standards.
Copper Mountain Technologies offers a broad portfolio of VNAs to address virtually every measurement application, from compact 1-port reflectometers for embedded sensing and production test, to high-performance 2-port and multiport analyzers covering frequencies from 9 kHz to 22 GHz directly, and up to 330 GHz with external frequency extenders.
In addition to the hardware, Copper Mountain Technologies provides an extensive library of technical resources, including application notes, white papers, webinars, and instructional videos covering calibration methods, uncertainty analysis, time-domain measurements, material characterization, and production automation.
When your design decisions depend on trustworthy S-parameter data, measurement integrity is not optional. Choose an instrument built on sound metrology and backed by a company dedicated exclusively to vector network analysis.
Discover more Technical Resources
Rethinking mmWave Measurement: Beyond the Traditional VNA
-
Advantages of Running CMT VNA Software on ARM Platforms for Distributed RF Sensing
-
Optimizing RF Production Testing with 1-Port VNA Solutions
-