


VNA Time Domain Processing
February 22, 2024Introduction
A Vector Network Analyzer (VNA) measures devices by emitting a series of frequencies and charting how much of the signal either reflects or passes through a device in each direction. Specifically, the reflection from the input of a Device Under Test (DUT) from port 1 is the S-parameter S11. The signal passing through from input to output is labeled S21. If the VNA switches the stimulus signal to Port 2, the signal reflected from the output of the DUT is labeled S22 and the signal passing backward through the DUT is labeled S12. Figure 1 shows the forward measurement of a DUT.

Figure 1 – VNA Measuring in the Forward Direction
A tabulation of these four measurements over a range of frequencies is called a Touchstone file and with it, a DUT may be simulated in a linear simulation program. The four S-parameters are sufficient to fully characterize any linear two-port device.
What is the Frequency Domain and the Time Domain?
A VNA measurement of a filter is commonly displayed in the Frequency Domain as shown in Figure 2. Here, the VNA swept from 3.5 to 4.5 GHz and the frequency response, S21 shows the passband and stop-band, and the reflection—or return loss—is shown in the S11 measurement.
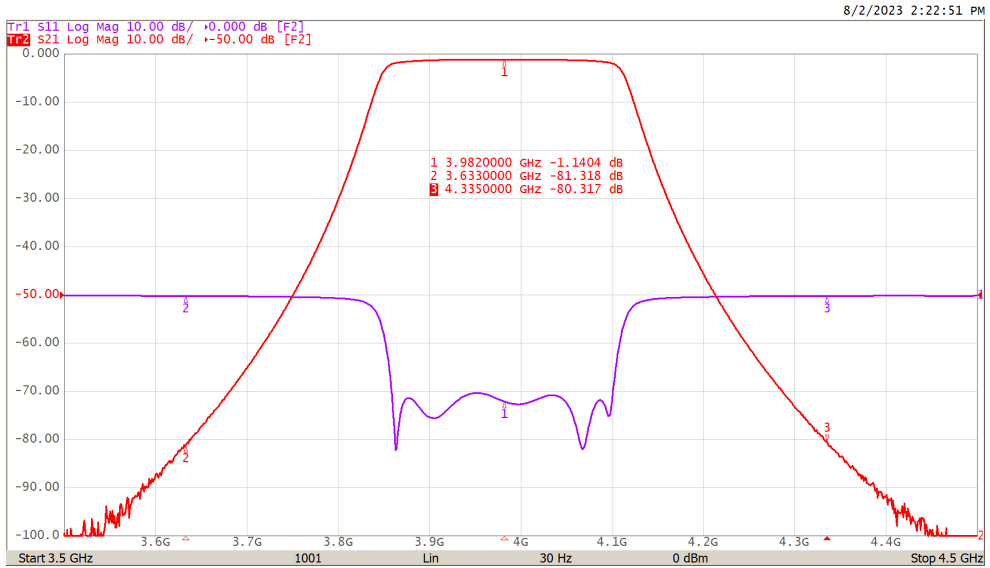
Figure 2 – Filter Measurement
This measurement is said to be in the frequency domain because the results are given as a function of frequency. The X axis of Figure 2 is the frequency axis and the Y axis shows the amplitude of the signal passing through or being reflected. In contrast, if we apply an inverse Fourier Transform to the frequency domain data, we obtain a Time Domain representation of the data.
What is the Discrete Fourier Transform?
Because we have discrete measurements over frequency, we’ll apply the time domain equation, an Inverse Discrete Fourier Transform (IDFT).

Those who have experience with Digital Signal Processing (DSP) might be aware of the DFT and IDFT. A sampled time domain signal might contain a number of frequency components with various amplitudes and a DFT will reveal these components and their amplitudes. Because it is the inverse function, applying an Inverse Discrete Fourier Transform (IDFT) to the frequency domain data will convert it back to the original time domain signal.
For example, we can add two sine waves, one at 30 kHz and the other at 75 kHz with amplitudes of 1 and 3 respectively and the result looks like this:

Figure 3 – 30 kHz and 75 kHz Signals
It is difficult to pick out the two frequencies by inspection. We can apply a Hamming window function to this data and then perform a DFT to discern them. The windowing is required to prevent unwanted side-lobes in the response.

Figure 4 – Hamming Window Applied
And now the DFT:
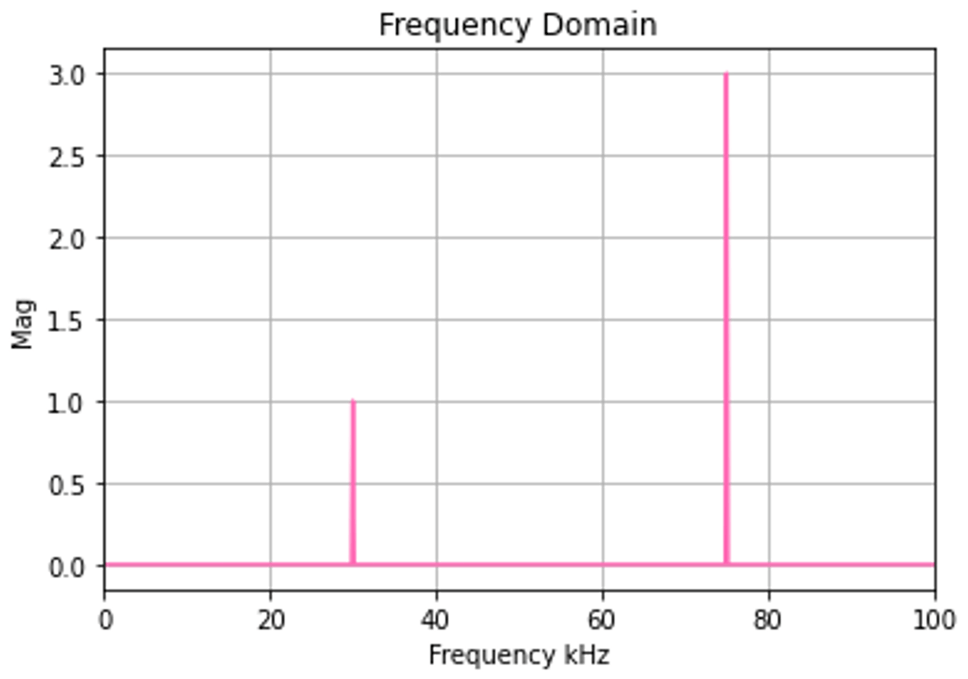
Figure 5 – Frequency Domain plot
We clearly see the two spectral components of the signal.
What is the Time Domain in a VNA?
The earlier example showed how Fourier analysis is useful for spectral analysis. For VNA measurement, we want to go the other direction. We want to take the reflection results over a frequency range and process these to obtain reflection characteristics along a transmission line vs time or distance along that line.
The IDFT of VNA reflection data is different from the spectral analysis of Figure 5. To understand this, we need to understand that the Fourier Transform of a time domain Dirac Delta function located at time zero generates all frequencies from zero to infinity. The delta function is an infinitely thin, infinitely tall discontinuity with an area of one if integrated. For the discrete approximation, the DFT of a delta function at time zero is a series of discrete frequencies from zero to infinity with equal amplitude and the same starting phase at time zero.
The DFT of a delta function, offset in time, is also a series of equal amplitude frequencies but with linearly changing phase shift due to the delay. This makes sense, as the phases of the signals all line up at the instant of the impulse and as one moves forward or backward in time from it, the phase shift of each frequency will change; More for higher frequencies and less for lower. See the depictions in Figure 6 and Figure 7 below. (Note that the time axes are completely arbitrary)

Figure 6 – Delta Function at T=0

Figure 7 – Equivalent Discrete Frequencies
The waves shown in Figure 7 look a lot like what might be measured by a VNA at each frequency if making a Thru measurement from Port 1 to Port 2 or the reflection from an Open or Short at Port 1 or 2.
If calibration is performed on the VNA of Figure 1 at the end of the test cables, the reference plane will be moved to the end of those cables. Zero phase for all frequencies will be referenced to this point. If the cables are connected together and the VNA set to measure S21, we’ll find that each measured frequency is of equal amplitude and zero starting phase as in Figure 7, and the Time Domain analysis of the data will be an impulse located at zero time as in Figure 6.
If we now add a short length of cable to be tested between the ends of the test cables, the time domain delta function of S21 will shift to the right in time equal to the delay of the cable. This delta function represents the impulse response of the Cable Under Test (CUT). If the CUT exhibits dispersion—variation in delay with frequency—the impulse response will be distorted. Simulated digital data may be convolved with this impulse response to obtain the delayed and somewhat degraded output expectation.

Figure 8 – Impulse Response of Cal Kit Thru
As a Time Domain example, Figure 8 shows the impulse response of the Thru from the calibration kit. Note that an 18 GHz VNA was used to make the measurement and the minimum impulse width is 54.2 ps due to the VNA bandwidth and using the normal window function for minimal sidelobes. Here, the response of the Thru is quite good and there is no visible distortion of the impulse.
On the other hand, we might measure a lossy cable. In Figure 9, we see the impulse response of a three-meter length of RG174 cable. The delay through the cable is about 15.4 nS and significant distortion is visible.

Figure 9 – 3m Length RG174
What Can We Do with the Impulse Response?
To see how useful this impulse response can be, we can create a simulated bit-stream as in Figure 10.

Figure 10 – Simulated Bit-Stream
We can then convolve this bitstream with the impulse response from Figure 9 to simulate the effect of the cable on the digital signal.

Where f is the digital data and g is the impulse. The result in Figure 11 is a delayed and distorted version of the original data. (The amplitude has not been normalized back to 1.0).

Figure 11 – Distorted Data
This sort of analysis might be used to determine the expected distortion of a digital signal traveling on a high-speed digital “lane” on a printed circuit board. Different amounts of pre-emphasis could be added to the input data to see how much improvement can be expected. The appropriate pre-emphasis could then be programmed into the FPGA creating the signal.
What Does TDR Mean in RF Measurement?
TDR stands for Time Domain Reflectometry. Previously, one could analyze the characteristics of a transmission line by firing a pulse with a very fast rise-time into it from a 50Ω pulse generator and then watching for any reflections which might return. Negative-going reflections indicate an impedance less than 50 ohms has been encountered and Positive-going reflections indicate higher than 50-ohm impedances. The time between the leading edge of the test pulse and that of the reflection gives the round-trip distance to the defect causing the reflection.
This method was useful but required a very high bandwidth oscilloscope to view the results, perhaps 1 GHz. The high bandwidth of the measurement results in a high noise floor, 14 μV RMS or so at room temperature which limits the dynamic range. The 1 GHz bandwidth doesn’t give very good resolution as pulse rise-times would be limited to about 350 pS.
Instead of using a pulse, we can use a series of frequencies which are equivalent to a pulse when added together and measure each frequency in a narrow VNA IF bandwidth, maybe 1 kHz. This improves the dynamic range of the measurement by six orders of magnitude. The frequency span of the VNA also means that the effective width of the virtual test pulse can be very narrow, perhaps 50 pS for a 20 GHz span with rise and fall-times of about 20 pS.
The IDFT may also be performed on reflection data. The test board shown in Figure 12 has a 50Ω line with a small 25Ω section in the middle. This is useful for demonstrating time domain reflections.

Figure 12 – Test Board
Because of the 25Ω section, the overall return loss of the trace is terrible, about 7 dB:

Figure 13 – Test Board RL
Taking the IDFT of this data using the Time Domain function of the VNA we can see the reflections causing this poor return loss.

Figure 14 – Time Domain Measurement of Test Board
The small double bump at the left side is the reflection from the inside of the SMA connector followed by the reflection from the launch transition from the SMA pin to the microstrip trace. The next two large bumps are the reflections from each side of the 25Ω trace. The small bump to the right of the two large ones is an imperfection of the PCB and finally on the right-hand side we see the reflection from the output connector.
Note that large reflections tend to occlude those which come after. This is why the second bump from the 25Ω trace is smaller than the first and the output connector bump is only a single reflection instead of two. If we were to switch to an S22 time domain measurement, we would see the same results, but the left-hand side would show reflections from what was previously the output connector. In Figure 15 the S22 measurement image has been flipped horizontally to emphasize how large reflections occlude those which follow. Figure 14 is a left to right measurement and Figure 15 a right to left measurement on the test PCB.

Figure 15 – S22 Reflection – Flipped Horizontally
What Does a Time Domain Reflectometer Do? What Does TDR Mean for a Transmission Line?
A Time Domain Reflectometer measures reflected voltage signals in the time domain as shown in Figure 14. This might be done with a pulse generator and an oscilloscope, or it may be done with an IDFT processed 1-port measurement from a VNA. The reflections, or lack thereof, indicate the health of a transmission line. A good transmission line loaded with a resistive load matching its characteristic impedance will exhibit almost no reflection. In other words, a pulse applied by a 50Ω pulse generator into a 50Ω coaxial cable will be completely dissipated in the 50Ω load at the other end and there will be no reflection.
Water which has seeped into the cable dielectric or crimps and kinks will cause reflections. The time delay of the reflection is proportional to the distance-to-fault and may be used to precisely locate the source of a problem.
Time Domain analysis may be used on extraordinarily long cables. An 18 GHz VNA set for a start frequency of 500 kHz, stop of 18 GHz and 36,000 points will be able to measure out to 885 ft for low-loss cable having a velocity factor of 0.9. The resolution will be 28 pS or 0.3”. Reducing the stop frequency to 9 GHz would double the range to 1,770 ft but with a commensurate loss of resolution.
What is the Lowpass Mode for Time Domain Conversion?
The Fourier transform of a real-valued data set is complex with symmetry around zero. Corresponding negative and positive frequency results are always complex conjugates. If it isn’t known, the value at zero may be interpolated.
This feature is exploited for highest resolution VNA Time Domain conversion. A reflection measurement is made starting at frequencies close to zero and each frequency is harmonically related, that is:
Fstart, 2*Fstart, 3*Fstart…. Fstop
This might be 1 MHz, 2 MHz, 3 MHz… 1000 MHz, that is the VNA would be set for 1000 points with Start Frequency 1 MHz and Stop Frequency 1000 MHz. The complex reflection coefficients at each frequency point are measured and then the data array is expanded to include negative frequencies, -1 MHz, -2 MHz, -3 MHz… -1000MHz and the complex conjugates of the positive frequency measurements are filled in. (This string (vector) of negative and positive frequencies is also called a Hermitian). The value for zero may be interpolated from the points on either side or it may be entered based on knowledge of the measurement. A coaxial cable open on the end will have a reflection of 1+j0 at zero frequency, while a cable with a short on the far end will have a reflection of -1+j0 at zero frequency.
With the data array expanded like this, we can take the inverse DFT and arrive at a real result with twice the time resolution we would otherwise achieve.
The lowpass mode may only be used if a measurement can be made starting at a low frequency. If the measurement must be made through a bandpass filter or a waveguide, the measurement range will have to be limited to what will pass through it. In this case, the bandpass mode must be chosen in the Time Domain menu. The resolution of the measurement will be reduced, equal to 


The lowpass mode gives twice the resolution and half the range. Resolution 


What is the Lowpass Step Mode?
If the reflection data is taken at harmonically related points as required by the Lowpass Impulse mode, the Lowpass Step mode may be used. Because reflection information is available on both sides of zero frequency and including zero, the step function may be analyzed. This mode allows one to evaluate reflection vs time or distance.
Additionally, one can enable Conversion mode and display cable characteristic impedance vs time or distance.

Figure 16 – Return Loss of Fixture vs Time
Figure 16 shows the return loss vs time for the fixture of Figure 12. The return loss bump of the connector is seen at the far left, followed by the good return loss of the 50Ω line. The poor return loss of the 25Ω line is seen in the middle and the return loss of the 50Ω line which follows it should be good as well, but it is obscured by the huge reflection of the 25Ω line before it.
Engaging “Conversion” from the Analysis menu, we can see the characteristic impedance of the lines vs time.

Figure 17 – Characteristic Impedance vs Time
The 50Ω section is clearly seen followed by the 25Ω section. Again, the characteristic impedance measurement of the 50Ω trace after the 25Ω section is not very good due to the high reflection before it.
What is Time Gating Analysis?
We might want to measure a DUT which has reflections causing impairments in front or after it. If the reflections from the impairments are bad enough, they can dominate the measurement and prevent an accurate reading of the DUT. If we perform a wide-band reflection measurement on the system and then move to the time domain, we’ll clearly see the reflection impulses caused by the impairments. We can then suppress those impulses by applying a notch-window function to them and then move back to the frequency domain. The new measurement is now a function of the DUT alone for the most part.
Two things to note. First, we didn’t just zero the impulses from the impairments, we used a window function to suppress them gracefully. This is necessary to prevent the formation of side-lobes in the frequency domain. Any abrupt changes will result in unacceptable ripples in the result. The window width must also be chosen such that it’s skirt doesn’t affect reflections from the DUT so there must be some small distance between the impairment and the beginning of the DUT.
Secondly, as mentioned earlier, if the reflection from the first impairment is large enough, the transmitted energy to the DUT will be reduced and reflections from it will be reduced as well. Thus, the DUT will look like it is matched better than it really is.
We can take the Time Domain response of the test board of Figure 12 shown in Figure 14 and gate out the two impulses caused by the beginning and end of the 25-ohm section. It is interesting to note that the two reflections occur at the start and end of the 25-ohm section. There is no significant reflection along the continuous 25-ohm line itself. This Time Domain response is repeated in Figure 16 as calculated using Python. A pair of inverted Kaiser windows as in Figure 19 may be used to suppress them.

Figure 18 – Time Domain of the Test Board

Figure 19 – Notch Windows
The gated result is shown in Figure 18. We can then apply the DFT transform to go back to the frequency domain and the result is shown in Figure 21. The return loss is now better than 20 dB, a great improvement from 5 dB.

Figure 20 – Gated Time Domain Response

Figure 21 – Gated Frequency Domain
Time Domain gating such as this is an analytical capability built into almost all VNAs built by Copper Mountain Technologies.
Conclusion
You can find a great deal of information about Vector Network Analysis in the technical section of our website. You’ll find videos and webinars that address many aspects of measurement. Our many VNAs cover frequencies from 9 kHz to 330 GHz and may be used to make precision measurements in the laboratory or in the field. Do you see a VNA that you would like to try out? Each product page includes a link to request a trial.
Additionally, our VNA UI/UX software may be downloaded without charge. The software may be operated in demo mode to help a new user familiarize themselves. It may be used to view S-parameter files obtained from anywhere and Time Domain or Gating may be applied if desired.