


A Copper Mountain Technologies USB VNA separates the measurement module (VNA) from the processing module (software on a computer), bringing the measurement results to any external PC using the VNA software. Because of this you can emulate measurements through CMT’s free software without a physical VNA. If you are trying to teach RF & microwave measurements to students without direct access to a VNA, there are several ways they can learn just by using the VNA software interface. Students can download the CMT VNA software at any time for free on their PC or Linux computer.
Demo mode is easy to access and allows you to simulate the use of various VNA models directly from the software. You can explore several S-parameter display types such as regular, polar, and Smith chart formats. Touchstone file saving allows the user to save frequencies and S-parameter results into an industry standard .s1p file format. CMT VNAs can easily be automated and various programming examples are available on our website for MATLAB, C++, C#, Python, VEE, LabVIEW, etc.
Below is an in-depth look at how students and other beginners can use the VNA software to continue learning and gain valuable experience without the use of a VNA measurement module.
1) Demo mode
The CMT RVNA, TRVNA, S2VNA, and S4VNA softwares are always available to download for free on the Copper Mountain Technologies website. Click the Download Demo Software button on the top right of any page on the Copper Mountain Technologies website or download the software here.
Demo/simulation mode of the VNA application can be enabled or disabled after installation as well. The procedure and menu appearances differ slightly among the four CMT software families. In the following sections the demo mode selection procedure for R, TR. S2 and S4 software family members will be demonstrated.
In order to switch between demo mode and measurement mode, follow the procedures:
- Click “System”.
- Click on “Demo Mode” to toggle ON/OFF demo mode (Note: Application will restart).
- Click on “Analyzer Model” to change which model is being simulated.
In order to switch between demo mode and measurement mode, follow the procedures:
- Click “System -> Misc Setup”.
- Click on “Demo Mode” to toggle ON/OFF demo mode (Note: Application will restart).
- Click on “Analyzer Model” to change which model is being simulated.
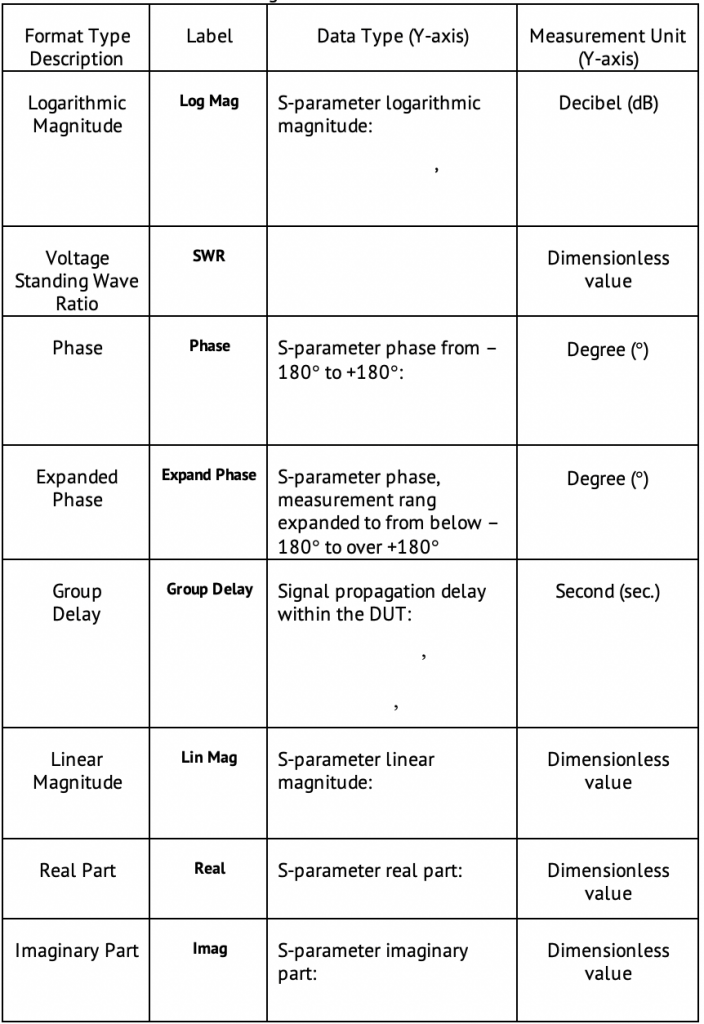
2) Explore different data formats
CMT Network Analyzers offer three S-parameter measurement display types:
- rectangular format;
- polar format;
- Smith chart format.
Rectangular Format
In this format, stimulus values are plotted along X-axis and the measured data are plotted along Y-axis, like in the figure below.

To display complex-valued S-parameters along the scalar Y-axis, it must be transformed into a real number. Rectangular formats involve various types of transformation of an S-parameter , where:
a – real part of S-parameter complex value;
b – imaginary part of S-parameter complex value.
There are eight types of rectangular formats depending on the measured value plotted along Y-axis indicated in the table below.
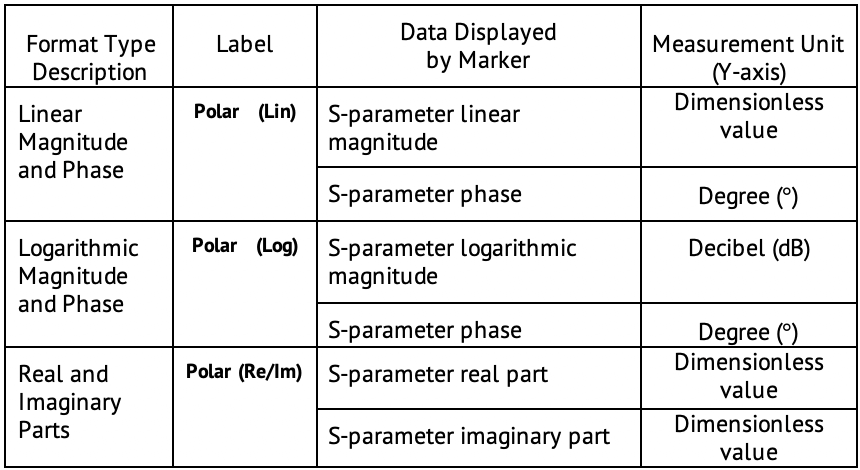
Polar Graph Format
Polar format represents the measurement results on the polar chart, like in the figure below. The distance of a measured point from the graph center corresponds to the magnitude of its value. The counterclockwise angle from the positive horizontal axis corresponds to the phase of the measured value.
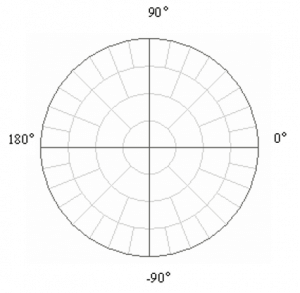
The polar graph does not have a frequency axis, so frequency is indicated by markers. There are three types of polar formats corresponding to the data displayed by the marker; the traces remain the same for all the format types.
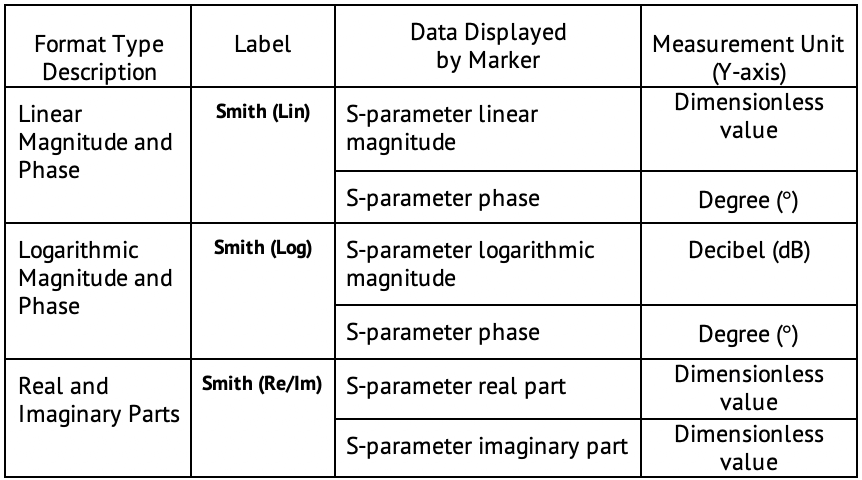
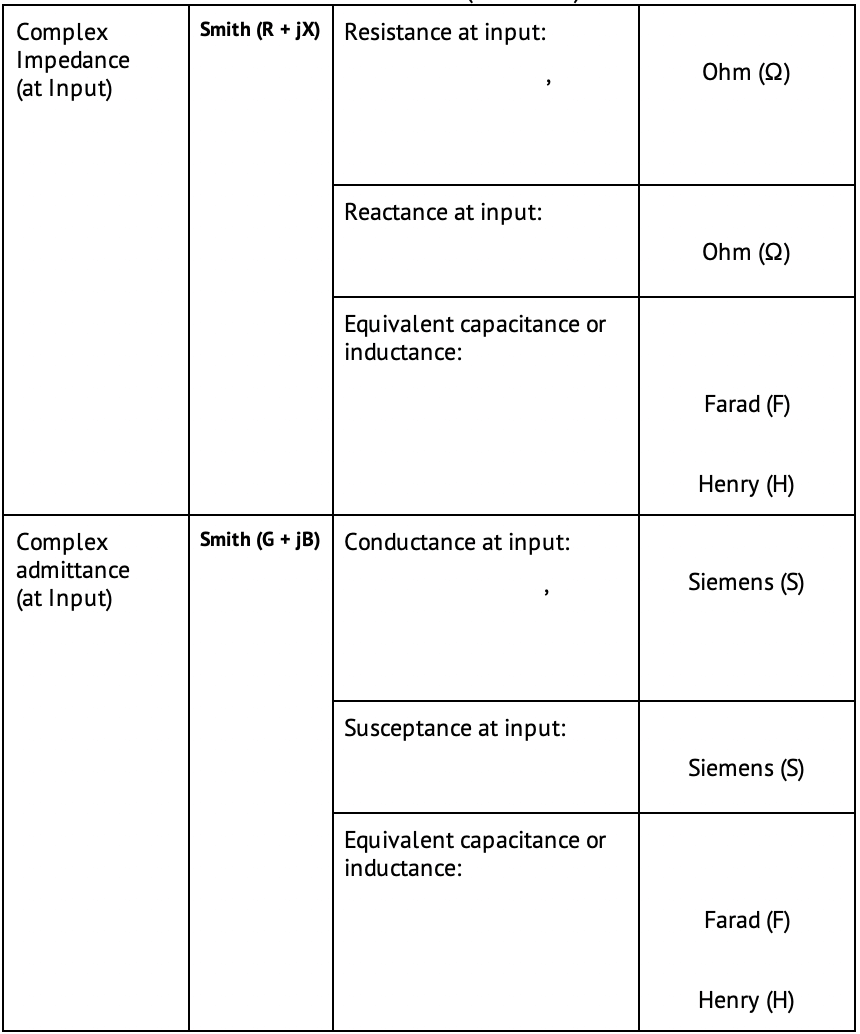
Smith Chart Format
Smith chart format is used for representation of impedance values for DUT reflection measurements. In this format, the trace has the same points as in polar format.
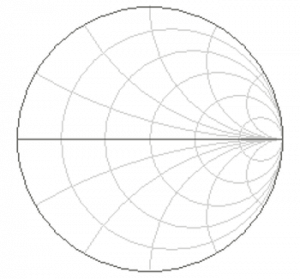
The Smith chart does not have a frequency axis, so frequency is indicated by markers. There are five types of Smith chart formats corresponding to the data displayed by the marker; the traces remain the same for all the format types.
3) Touchstone files
Touchstone file saving allows the user to save frequencies and S-parameter results into an industry standard .s1p file format. In addition, the software can be used as a Touchstone file viewer, which allows the user to graphically display and work with previously saved Touchstone files.
The Analyzer allows the user to save S-parameters to a Touchstone file. The Touchstone file contains the frequency values and S-parameters. The files of this format are typical for most of circuit simulator programs.
The *.snp files are used for saving the S-parameters of a device.
For more information about saving or recalling Touchstone files, view section 7.4.1 in the S2 Operating Manual.
4) Automation
Copper Mountain Technologies’ VNAs can be readily automated and there are numerous options for users who wish to do so. To help illustrate the different automation methods and interfaces available, consider the components in an automated VNA measurement system. There is hardware: the VNA itself and a computer. There is software, as well: the VNA control software loaded onto the computer. While non-automated use of these components consists of each of these components in this basic configuration, automation options alter this configuration.
Automatic control of the VNA is straightforward. The VNA can be automated by a set of industry standard SCPI commands via TCP/IP or HiSLIP network protocols, or alternatively by SCPI-like COM/DCOM commands. There are various programming examples for MATLAB, C++, C#, Python, VEE, LabVIEW, etc. available on our website. Additional guides and examples are available upon request.
You can learn more about CMT VNA automation here.