The channel status bar is located in the bottom part of the channel window (See figure below).
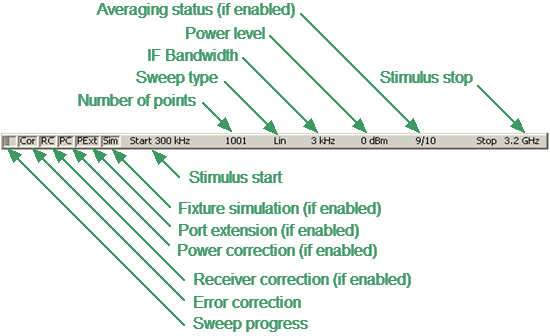
Channel status bar
It contains the following elements:
•Sweep progress field displays a progress bar when the channel data is being updated.
•Error correction field displays the integrated status of error correction for S-parameter traces. The values of this field are represented in the table below. For a detailed description, see Error Correction Status.
Symbol |
Definition |
Note |
|---|---|---|
Cor |
Error correction is enabled. The stimulus settings are the same for the measurement and the calibration. |
If the function is active for all traces — black characters on a gray background. If the function is active only for some of the traces (other traces are not calibrated) — white characters on a red background. |
C? |
Error correction is enabled. The stimulus settings are not the same for the measurement and the calibration. Interpolation is applied. |
|
C! |
Error correction is enabled. The stimulus settings are not the same for the measurement and the calibration. Extrapolation is applied. |
|
Off |
Error correction is turned off. |
For all traces. White characters on a red background. |
— |
No calibration data. No calibration was performed. |
•Receiver correction field displays the integrated status of receiver correction for absolute power measurement traces. The values of this field are represented in the table below. For a detailed description on correcting receivers see Receiver Calibration.
Symbol |
Definition |
Note |
|---|---|---|
RC |
Receiver correction is enabled. The stimulus settings are the same for the measurement and the calibration. |
If the function is active for all the traces — black characters on a gray background. If the function is active only for some of the traces (other traces are not calibrated) — white characters on a red background. |
RC? |
Receiver correction is enabled. The stimulus settings are not the same for the measurement and the calibration. Interpolation is applied. |
|
RC! |
Receiver correction is enabled. The stimulus settings are not the same for the measurement and the calibration. Extrapolation is applied. |
•Power correction field displays the integrated status of power correction for all the traces. The values of this field are represented in the table below. For a detailed description of power correction, see Power Calibration.
Symbol |
Definition |
Note |
|---|---|---|
PC |
Power correction is enabled. The stimulus settings are the same for the measurement and the calibration. |
If the function is active for all traces — black characters on a gray background. If the function is active only for some of the traces (other traces are not calibrated) — white characters on a red background. |
PC? |
Power correction is enabled. The stimulus settings are not the same for the measurement and the calibration. Interpolation is applied. |
|
PC! |
Power correction is enabled. The stimulus settings are not the same for the measurement and the calibration. Extrapolation is applied. |
•Port extension field indicates whether this function is active and applied to one or all traces. If the function is enabled for all traces, black characters will be displayed on a gray background. If the function is enabled just for some of the traces, white characters will be displayed on a red background. For a detailed description, see Port Extension.
•Fixture simulation field indicates whether this function is active and applied to one or all traces. Fixture simulation includes the following operations: Z0 conversion, embedding, and de-embedding. If the function is enabled for all traces, black characters will be displayed on a gray background. If the function is enabled just for some of the traces, white characters will be displayed on a red background. For a detailed description, see Fixture Simulation.
•Stimulus start field allows for display and entry of the start frequency or power, depending on the sweep type. This field can be switched to indicate the stimulus center frequency, in this case the word «Start» will change to «Center». For a detailed description of stimulus setting, see Sweep Range.
•Number of Points field allows to display and entry the number of sweep points. The number of points can be set from 2 to the instrument maximum. For a detailed description, see Number of Points.
•Sweep type field allows for display and selection of the sweep type. The values of this field are represented in the table below. For a detailed description, see Sweep Type.
Symbol |
Definition |
|---|---|
Lin |
Linear frequency sweep. |
Log |
Logarithmic frequency sweep. |
Segm |
Segment frequency sweep. |
Pow |
Power sweep. |
•IF bandwidth field allows for display and setting of the IF bandwidth. The values can be set from the instrument minimum up to 1 MHz for some models. For a detailed description, see IF Bandwidth Setting.
•Power level field allows for display and entry of the port output power. In power sweep mode, the field switches to indicate the CW frequency of the source. For a detailed description, see Stimulus Power.
•Averaging status field displays the averaging status, if this function is enabled. The first number is the averaging current counter value, the second one is the averaging factor. For a detailed description, see Averaging Setting.
•Stimulus stop field allows for display and entry of the stop frequency or power, depending on the sweep type. This field can be switched to indication of stimulus span, in this case the word «Stop» will change to «Span». For a detailed description of stimulus setting, see Sweep Range.