The following figure shows a flowchart of the Analyzer's internal data processing flow. For a detailed description of remote control access to internal data arrays see in Internal Data Arrays.
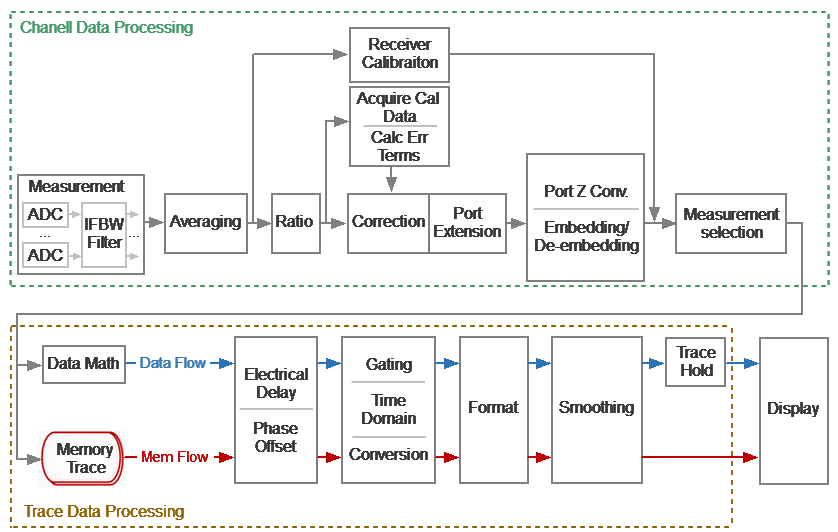
Data Processing Flowchart
The Analyzer's internal data processing consists of the following stages:
•Measurement is a converting analog signals of receiver into digital ones (2-channel receiver receive the signal of the incident wave and the signal reflected from the device under test or passed through the DUT for RNVNA). The received analog measurement signals are converted by ADC (analog-to-digital converters) into digital IF signals and transmitted to the digital processor. The digital processor performs a discrete Fourier transform (DFT) of the IF signals. The Analyzer IF bandwidth is equivalent to the bandwidth of the DFT filter. The digital output of each receiver is represented as complex numbers). For more details see Principle of Operation.
•Averaging is averaging of the measured data of the receivers for a given number of scan cycles. For more details see Averaging Setting.
•Receiver Calibration is a gain correction of individual receivers for absolute measurements.
•Ratio is calculating S-parameters by dividing the complex values of two receiver signals. See The Principle of Measuring S-parameters.
•Acquire Cal Data is measuring calibration standards. Complex measured data of all standards are stored in memory. For more details see Calibration Methods and Procedures.
•Calc Error Terms is calculation of calibration coefficients based on measurement data of calibration standards in accordance with the selected calibration method. Calculated calibration coefficients are stored in memory. After calculating the calibration coefficients, the measurement data of the calibration standards is deleted. For more details see Systematic Errors.
•Correction is an application of calibration coefficients to raw S-parameters. At this stage, systematic measurement errors introduced by the analyzer and the measuring setup are eliminated. For more details see Calibration Methods and Procedures.
•Port extension is a fixture simulation in which the addition or removal of a transmission line of a given length for each test port is mathematically simulated. This allows to offset the calibration reference plane by the length of the line. For more details see Port Extension.
•Port Z Conv is the fixture simulation to convert the reference impedance to an arbitrary impedance value. See Port Reference Impedance (Z) Conversion.
•De-embedding is the fixture simulation to eliminate the influence of a certain circuit from the measurement results. See De-embedding.
•Embedding is the fixture simulation for embedding some virtual circuit in the measured circuit. See Embedding.
•Measurement Selector is a selection of display of measured S-parameter or absolute (receiver) data. Data for the trace is selected from a matrix of corrected S-parameters or corrected receiver data. See Measurement Parameters Settings.
•Memory Trace is copying current measurements to memory (S-parameter or receiver data). The software contains a set of cells for storing measurements (memory). Further, the memory data is processed in parallel with the measured data. See Memory Trace Function.
•Data Math — mathematical operations between measured data and data in memory. When using trace memory, the operation is performed with active memory. Available functions: add measured data to memory data, subtract memory data from measured data, multiply/divide measured data by memory data. The result of the operation replaces the measured data. See Memory Trace Function.
•Electrical Delay is adding/removing a transmission line of a given length without loss for the measurement port. Unlike port extension, the method is applied individually for each trace. See Electrical Delay Setting.
•Phase Offset is setting a constant phase offset of the trace. See Phase Offset Setting.
•Time Domain is conversion of the measured S-parameter in the frequency domain into the response of the circuit under investigation in the time domain. See Time Domain Transformation.
•Gating is a removal of unwanted responses in the time domain. See Time Domain Gating.
•Conversion (S-parameter conversion function) is conversion of the measured S-parameter into following ones: impedance (Zr) and admittance (Yr) in reflection measurement, inverse S-parameter (1/S), S-parameter complex conjugate (Conj). See S-Parameter Conversion.
•Format is selection of the display format of the measured data on the trace. See Format Setting.
•Smoothing is an averaging of adjacent points of the trace by a moving window. See Smoothing Setting.
•Trace Hold is holding the maximum or minimum values of the trace. See Trace Hold.
•Display — data processing for displaying on the screen in the form of a trace of a given format. Scaling is applied to the traces according to the data format, according to selected reference line position and value and scale/grid settings. See Channel Window Layout and Functions.