|
SWR and Reflection Coefficient Phase Analysis Using Markers |
Scroll Contact Us Home Prev Top Next More |
This section describes how to determine the measurement values at three frequency points using markers. The Analyzer screen view is shown the screen shot below. In the current example, a reflection standard of SWR = 1.2 is used as a DUT.
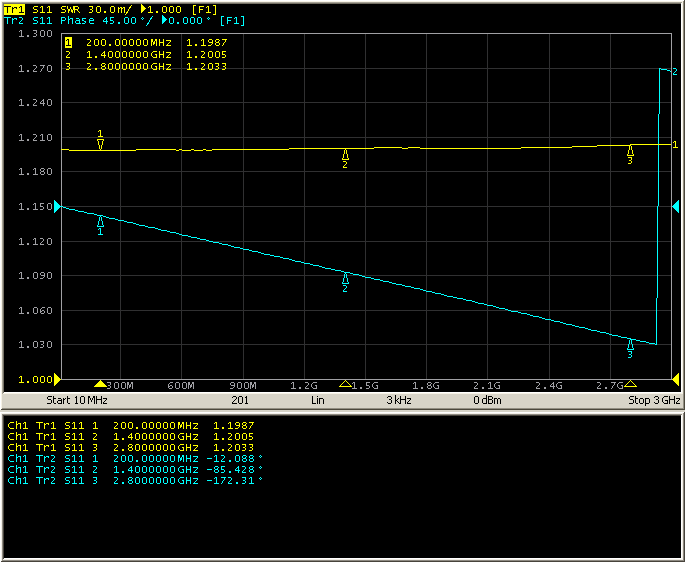
SWR and reflection coefficient phase measurement example
|
To create a new marker, use the following softkeys: Markers > Add Marker A new marker is placed in the center of the stimulus axis and assigned to be active. To edit just created marker, use the following soft keys: Markers > Edit Stimulus Then enter the frequency value in the input field in the graph, e.g. to enter frequency 200 MHz, press «2», «0», «0» and «M» keys on the keypad. Repeat the above procedure three times to enable three markers at different frequency points. |


By default, only active trace markers are displayed on the screen. To enable display markers of two traces simultaneously, activate the marker table.
|
To open the marker table, use the following softkeys: Markers > Properties > Marker Table |


note |
For more details on working with markers, see Markers, Markers, Marker Stimulus Value Setting. |