The software allows to adjust the following user interface settings:
•Toggle between full screen and window display (See Full Screen).
•The font size of all displayed items (See Font Size).
•Width of data traces, memory traces, graph grid (See Trace and Grid Width).
•Invert color of diagram (See Invert Color of Diagram).
•Show/hide the caption of channel (See Channel Caption Setting).
•Hide/show top menu bar (See Hide/Show Top Menu Bar).
•Hide/show cycle time (See Hide/Show Cycle Time).
•Set color of data and memory traces, markers, background, grid, font, and button (See Color).
•Change horizontal graticule (Hide/Show Horizontal Graticule Label).
If necessary, user interface settings can be reset to default factory settings (See Interface Presetting).
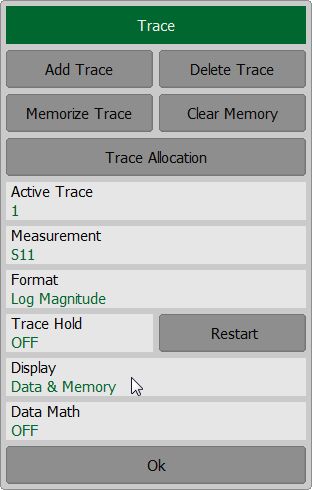
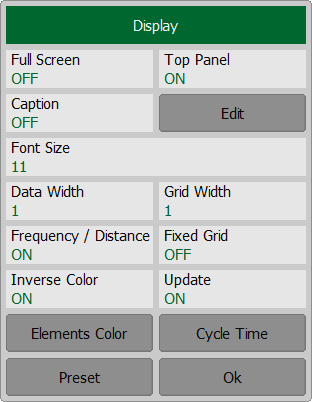
To open Display dialog with interface settings, click on Display softkey.
|
Full ScreenThe software on the PC screen is displayed as a window. If necessary, use full screen mode. To toggle between full screen and window display, click on Full Screen field. |
Hide/Show Top Menu BarBy default, the top menu bar is located at the top of the screen. The menu bar can be optionally hidden to gain more screen space for the channel window and is controlled by mouse. To show/hide the top menu bar, click on Top Panel field to toggle between the settings. |
Channel Caption SettingTo show/hide the channel title bar click on Caption field to toggle between the settings. To edit the channel title, click on the softkey Edit to recall the on-screen keypad. For a detail description see in Channel Title Bar. |
Interface PresettingAll set user interface settings can be reset. To restore the default factory settings, use the softkey Preset. |
Fixed GridThe setting sets the number of divisions of the channel window grid along the horizontal axis equal to 10. To turn ON/OFF the fixed grid, click on the Fixed Grid field. |
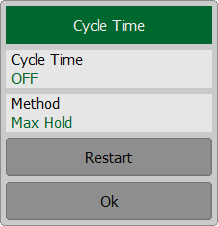
Hide/Show Cycle TimeBy default, the sweep time isn't displayed in the instrument status bar. It can be enabled if necessary. Depending on the selected method, cycle time can be defined as an average value or as a maximum hold. Click on the Cycle Time softkey. To enable/disable the display of the scan cycle time in the instrument status bar, click on the Cycle Time field. To toggle between method, click on Method field. The Restart softkey is used to restart the cycle time definition and reset the previous values.
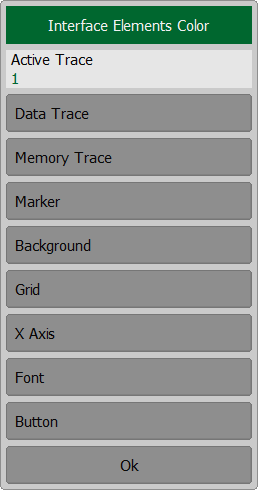
Color traces, markers, background, grid, font, and button colorThe color of data and memory traces, markers, the background, the grid, the font and the button can be changed if necessary. To change the color by categories of displayed items, click on the Elements Color softkey. To change the color of data and memory traces and markers, activate the trace, clicking on the Active Trace field. Then select displayed items to customize, clicking on Data Trace, Memory Trace or Marker softkeys. Select the color. To change the color of other settings, click the softkey with the corresponding name. Select the color.
|


