The trace manager displays the name and parameters of a trace. There are three ways to present the trace manager: tabular and inline (see figure below). By default, the trace manager is displayed in the channel window as tabular.
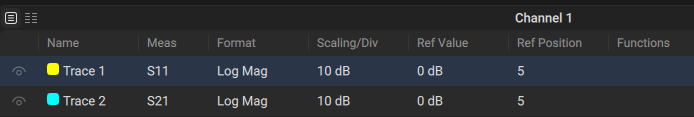
Tabular View

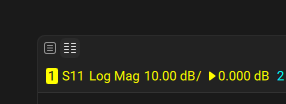
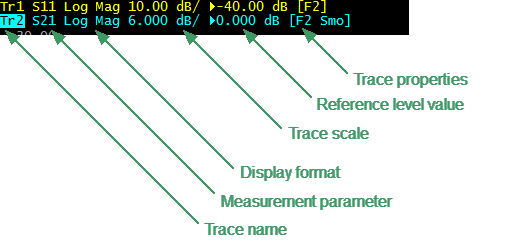
Inline View
Trace Manager
To switch between trace manager views, click on the required icon in the upper left corner of the channel window (see figure below). The left button is for tabular view and the right button is for inline view.
Buttons for Switching of Trace Manager View
NOTE |
With a large number of traces, use the tabular or inline view of trace manager to reduce the clutter of the channel window. |
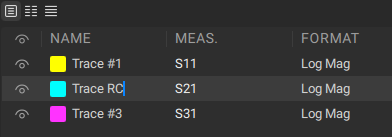
The number of rows in the trace manager depends on the number of traces in the channel. The trace manager is represented in the figure below.
Trace Status Field (Tabular View)
The trace manager allows the user to set the channel parameters quickly and easily. The operations described in this section help to adjust the most frequently used settings. The complete set of channel functions can be accessed via the sidebar.
Each line contains the data of one trace of the channel:
•Displaying a trace in a channel, where  indicates that the trace is visible, and
  indicates that the trace is hidden. The field is only available in tabular view.
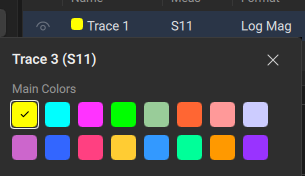
•The color picker of data trace. The field is only available in tabular view. The color picker can be set using the trace manager.
|
To change the color of the trace, click on the colored square next to the trace name and select the desired color. |
•The trace name from 1 to 64 (inline view), or the trace full name (tabular view). The active trace name is highlighted in an inverted color. For a detailed description of this setting, see Changing Trace Full Name.
•Measured parameter: S11, S21, ... S1616, or absolute power value: T1(n), T2(n), ..., T16(n), R1(n), R2(n), ... R16(n), or absolute power meter value: P1, P2,... P16. The conversion method is also displayed when measuring S-parameters (see table below). For a detailed description of the setting, see S-Parameters and Conversion Function.0
Status |
Symbol |
Definition |
|---|---|---|
Conversion |
Zr |
Reflection impedance |
Zt |
Transmission impedance |
|
Yr |
Reflection admittance |
|
Yt |
Transmission admittance |
|
1/S |
S-parameter inversion |
|
Ztsh |
Transmission-shunt impedance |
|
Ytsh |
Transmission-shunt admittance |
|
Conj |
Conjugation |
•Display format, e.g. Log Mag. For a detailed description of the setting, see Format Setting.
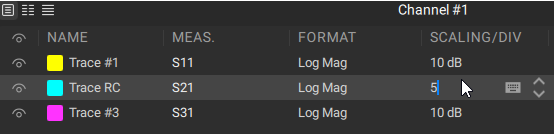
•Trace scale in measurement units per scale division, e.g. 10.0 dB. For a detailed description of the setting, see Rectangular Scale and Circular Scale.
•Reference level value, e.g. 0.00 dB. For a detailed description of the setting, see Rectangular Scale.
•Reference level position (the parameter is only available in tabular view), e.g. 5. For a detailed description of the setting, see Rectangular Scale.
•Trace functions (see table below). Trace functions is indicated as symbols in square brackets in line view of the trace manager.
Function |
Symbol |
Definition |
|---|---|---|
RO |
OPEN response calibration |
|
RS |
SHORT response calibration |
|
RT |
THRU response calibration |
|
OP |
One-path N-port calibration |
|
F1 |
Full one-port SOL calibration |
|
F2, F3, F4, F5, F6, F7, F8, F9, F10, F11, F12, F13, F14, F15, F16 |
Full N-port SOLT calibration (N take a value from 2 to 6/8/10/12/14/16. N depending on the Analyzer model, see corresponding datasheet) |
|
Other Calibrations |
RC |
Receiver calibration |
PC |
Power calibration |
|
Data Analysis |
Z0 |
Port impedance conversion |
Dmb |
Fixture de-embedding |
|
Emb |
Fixture embedding |
|
Pxt |
Port extension |
|
Trace Display |
No indication |
Data trace memory does not exist |
Data & Memory |
Data and memory traces |
|
Data |
Data trace only, memory exists |
|
Memory |
Memory trace |
|
Off |
Data and memory traces OFF |
|
Trace Hold |
No indication |
Trace hold OFF |
Max |
Hold the maximum value |
|
Min |
Hold the minimum value |
|
Memory Buffer |
No indication |
Memory buffer OFF (One memory trace) |
FIFO: n/m |
Memory trace n (m is queue depth) |
|
Math Operations |
No indication |
Data trace memory does not exist |
Data/Mem |
Data / Memory |
|
Data*Mem |
Data * Memory |
|
Data+Mem |
Data + Memory |
|
Data–Mem |
Data – Memory |
|
Off |
Math operation OFF |
|
Electrical Delay |
Del |
Electrical delay other than zero |
Smoothing |
Sm |
Trace smoothing |
Gating |
Gat |
Time domain gating |
Changing Trace Full Name Trace Manager
|
Switch trace manager in tabular view. |
|
Click on the trace name field in the trace manager. |
|
Enter a unique name of trace in the field.
|


|
Quick Trace Parameter Editing
|
Click on the required field in the trace manager. |
|
Enter or select the required parameter value.
|
|
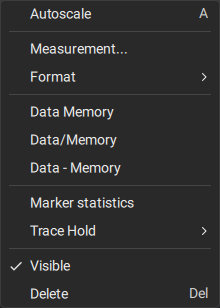
Quick Parameter Editing of Several Traces
Trace manager in tabular view allows the user to change parameters of several traces simultaneously. For example, you can assign the same format to all channel traces, or add memory traces to all traces at the same time.
|
Click on the CTRL button on the keyboard and highlight the rows in the table. |
|
Right-click on the selected rows and, in the pop-up window that opens, select the parameter to change (see figure below).
|
|