Each channel window can contain up to 64 different traces. Traces can be displayed in one diagram, overlapping each other, or in separate diagrams within a channel window (see figures below). Each trace can be placed into a separate diagram.
By default, the channel window contains one diagram with one trace.
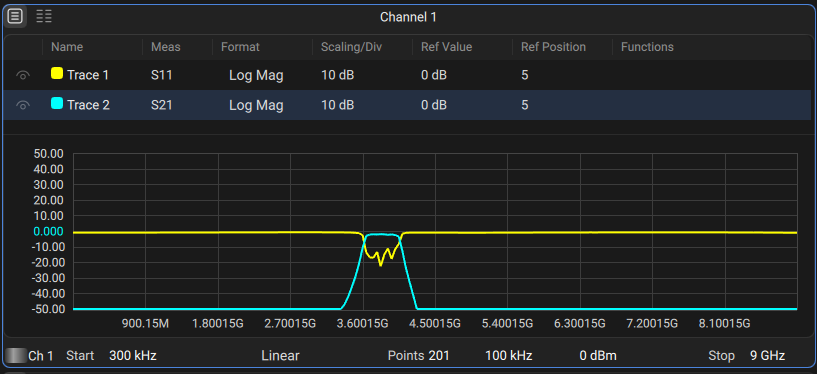
Displaying Two Traces on the Same Diagram |
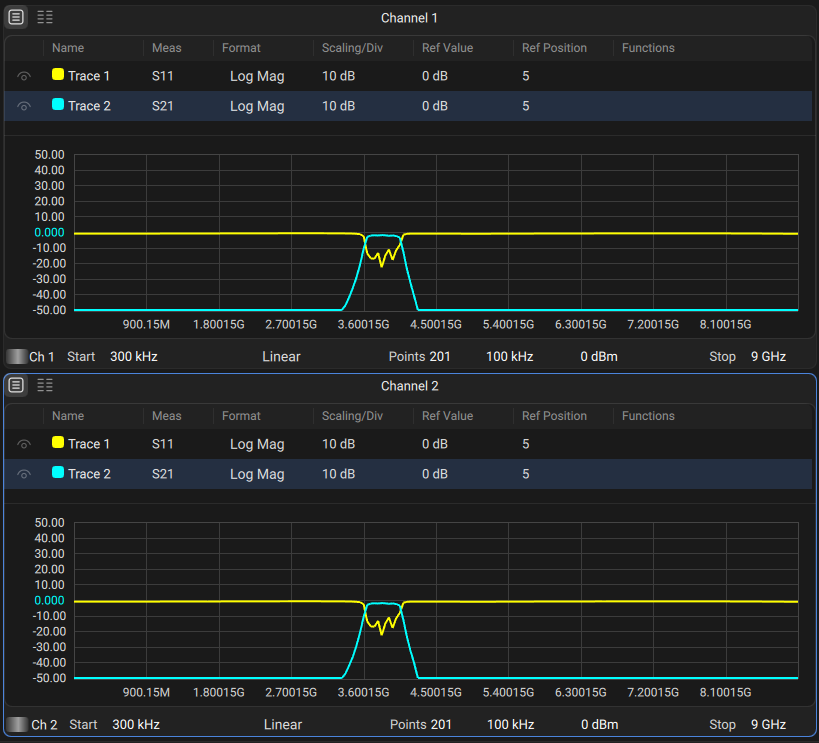
Displaying Two Traces on Two Different Diagrams |
Unlike channel windows, the number of traces and layout of the trace in diagrams are not related. The number of traces and the number of diagrams are set independently.
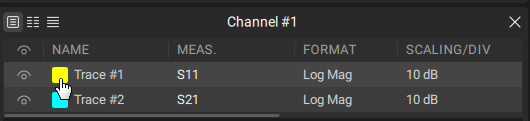
All traces are assigned an individual number which cannot be changed.
Each trace is assigned the following initial settings: name, measured parameter, format, scale, and color, which can be modified:
•By default, the display trace name is as follows: Trace #n, where n is a number of the trace.
•The measured parameters are set in the following succession: S11, S21...S1616. For a detailed description of changing measured parameter, see S Parameter.
•By default, the display format for all traces is set to logarithmic magnitude (dB). For a detailed description of changing display format, see Format Setting.
•By default, the scale parameters are set as follows: division is set to 10 dB, reference level value is set to 0 dB, and the reference level position is in the middle of the diagram. For a detailed description of changing scale parameters, see Scale Settings.
•The trace color is determined by its number. This color can be changed. For a detailed description of changing color, see Color Picker of Trace.
If two or more traces and diagrams need to be enabled, the number of traces and diagrams can be set as described below.
note |
The full cycle of the trace update depends on the set of measured S-parameters and the type of calibration. For example, a full cycle may include one sweep of port 1 as the signal source (when measuring S11). When measuring two traces S11, S22, two successive sweeps are performed. To measure the full matrix of S-parameters of the four-terminal network, four successive sweeps will be performed. When using a full 4-port calibration (SOLT), regardless of the number of traces and measured S-parameters, four successive sweeps are also performed. When using full n-port calibration (SOLT), regardless of the number of traces and measured S-parameters, n successive sweeps are also performed. |
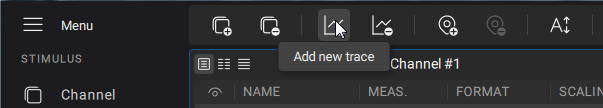
Adding Trace
|
Activate channel and diagram. |
|
Press Add Trace in the Quick Access Toolbar.
|


|
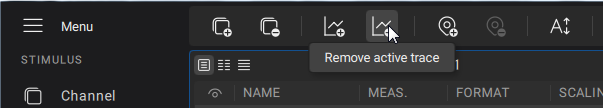
Deleting Trace
|
Select the trace. |
|
Press Remove Active Trace in the Quick Access Toolbar.
|
|
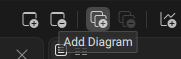
Adding Diagram
The new diagram is added last in the channel and contains one trace.
|
Select the channel. |
|
Press Add Diagram in the Quick Access Toolbar.
|
|
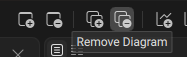
Deleting Diagram
When a diagram is deleted, all its traces are transferred to the diagram of the first diagram.
|
Select the channel. |
|
Press Remove Diagram in the Quick Access Toolbar.
|
|
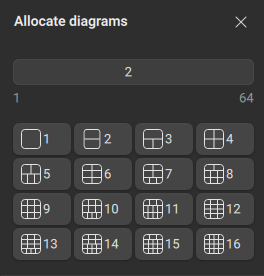
Diagram Allocation
The function places the required number of diagrams in the channel.
|
Click on the Display button in the sidebar. Press Allocate under the Diagram menu. |
|
Enter the required number of diagrams in the textbox in Diagram Allocation pop-up window. If the number of diagrams does not exceed 16, you can choose one of the layouts below the textbox.
|
|
Trace Visible
The function shows or hides a trace in the channel.
|
Setting trace visibility via the sidebar: •Select the trace (see Selection of Active Trace, Diagram, Channel). •Click on the Trace button in the main menu. •Select or clear the Trace visible checkbox in the submenu. Setting trace visibility via a trace manager: •Click on the icon |

|
Color Picker of Trace
The color of traces can be customized if necessary.
|
Setting color via a trace manager: •Click on the corresponding icon
•Select the color of the data trace in the pop-up window using either a standard palette. |

|