For the convenience of reading traces, the diagram area has a scale grid (See Diagram). The horizontal graticule label displays stimulus axis numeric data.
The analyzer provides two grid display modes for the stimulus axis — flexible grid or fixed grid.
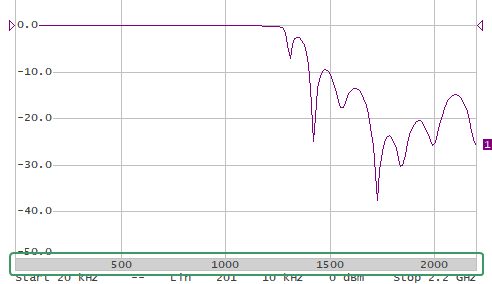
In flexible grid mode, scale grid options are selected automatically (See figure below).

Flexible Grid Mode
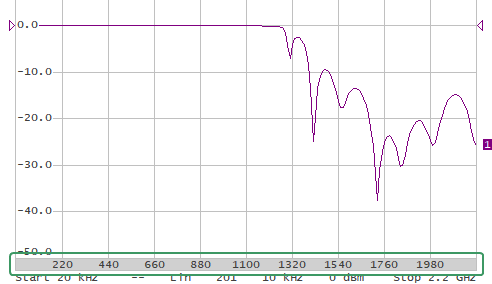
In fixed grid mode, the diagram area along the stimulus axis is always divided into 10 equal divisions (See figure below). Stimulus axis numeric data is calculated automatically based on the sweep range.

Fixed Grid Mode
|
To enable fixed grid mode, use the following softkeys: Display > Fixed Grid [ON | OFF] |
Rev.: 24.1

