The graph area in the channel window is called a diagram. The diagram displays traces and numeric data.
Diagram
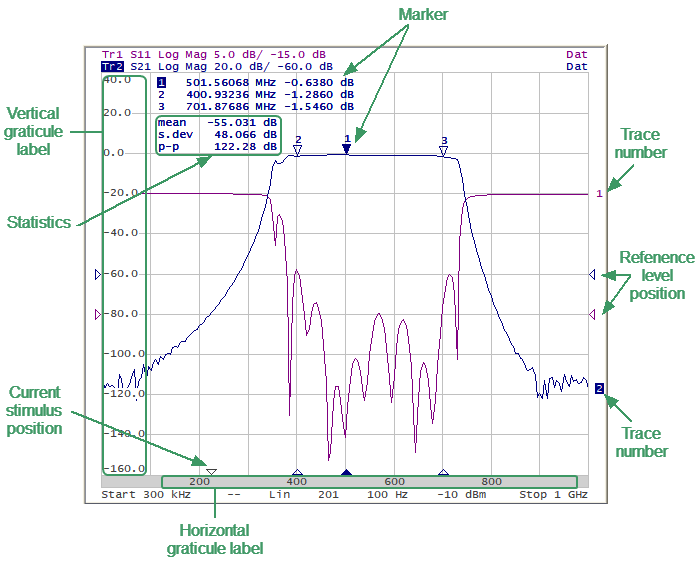
The diagram contains the following elements:
•Vertical graticule label displays the vertical axis numeric data for the active trace.
•Horizontal graticule label displays stimulus axis numeric data (frequency, power level or time). The horizontal graticule label can be hidden to gain more screen space for the trace display.
•Reference level position indicates the reference level position of the trace.
•Markers indicates the measured values at points along the active trace. The markers for all traces can be simultaneously displayed.
•Marker functions: statistics, bandwidth, flatness, RF filter.
•Trace number allows trace identification when printing in black and white.
•Current stimulus position indicator appears when sweep duration exceeds 1.5 sec.
note |
Using the graticule labels, the trace parameters can be easily modified using the mouse (as described in Quick Setting Using a Mouse). |