For a one-path measurement of the reflection coefficient and the transmission coefficient of a two-port DUT, the two ports of the Analyzer are used.
The signal flow graph of errors effect in a one-path two-port system is represented in the figure below.
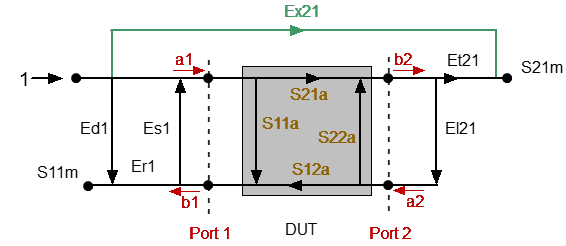
a1, a2 — incident waves, b1, b2 — reflected waves
S11a, S21a — actual value of DUT parameters
S11m, S21m — measured DUT parameters values
One-path Two-port Error Model
For normalization the stimulus value is taken equal to 1. All the values used in the model are complex. The measurement result in a one-path two-port system is affected by six systematic error terms.
These terms are also described in the table below.
Description |
Error |
|---|---|
Directivity |
Ed1 |
Source match |
Es1 |
Reflection tracking |
Er1 |
Transmission tracking |
Et1 |
Load match |
El1 |
Isolation |
Ex1 |
After determination of the four error terms (Ed1, Es1, Er1, Et1) for each measurement frequency by means of a one-path two-port calibration, it is possible to calculate the true value of the S11a. The calibration does not take into account El1 error and takes into account optional Ex1, that is why the measured value of S21m will become closer to the true value of S21a with the improvement of the source match and increasing the isolation.
For a detailed description of calibration methods, see Calibration Methods and Procedures.