Only Port 1 of the Analyzer is used when performing reflection measurements. The signal flow graph of errors for Port 1 is represented in the figure below.
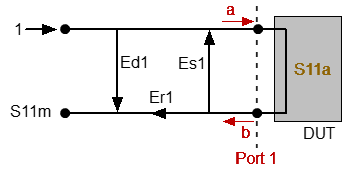
a — incident wave, b — reflected wave
S11a — reflection coefficient actual value
S11m — reflection coefficient measured value
One-port Error Model
The measurement result at Port 1 is affected by the following three systematic error terms:
•Ed1 — directivity.
•Es1 — source match.
•Er1 — reflection tracking.
For normalization, the stimulus value is taken equal to 1. All the values used in the model are complex.
After determining all the three error terms — Ed1, Es1, Er1 — for each measurement frequency by means of a full one-port calibration, it is possible to calculate (mathematically elimimate the errors from the measured value S11m) the actual value of the reflection coefficient S11a.
There are simplified methods, which eliminate the effects of only one or two of the three systematic errors.
For a detailed description of calibration methods, see Calibration Methods and Procedures.