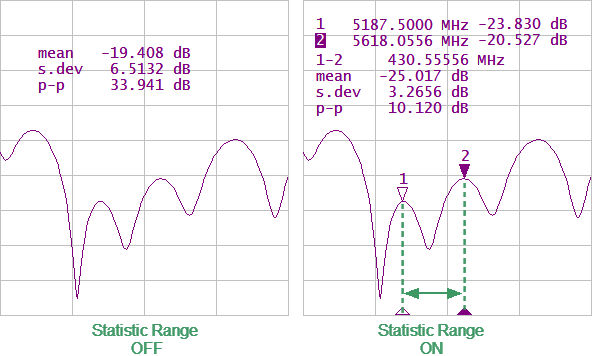
The trace statistics feature allows to determine and view trace parameters, such as mean, standard deviation, and peak-to-peak.
The range of trace statistics can be defined by two markers (See figure below).

Trace statistics
Trace Statistics parameter
Symbol |
Definition |
Formula |
|---|---|---|
mean |
Arithmetic mean |
|
s.dev |
Standard deviation |
|
p-p |
Peak-to-Peak: difference between the maximum and minimum values |
Max – Min |
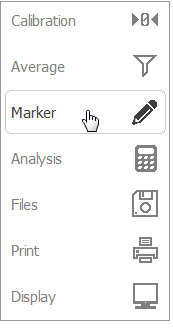
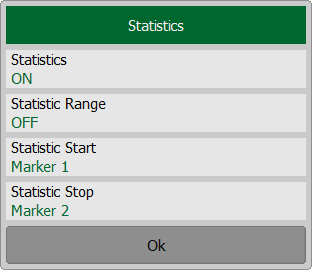
To enable/disable a trace statistics feature, use the softkeys Markers > Math > Statistics on left menu bar. Click on the Statistics field to toggle between the ON/OFF status. Click on the Statistics Range field to toggle between the on/off status. The statistics range is set by two markers. If there are no markers in the list, add two markers. Marker adding operation is described in Markers. Click on the Statistic Start or Statistic Stop field and select the required marker numbers from the list.
|


