note |
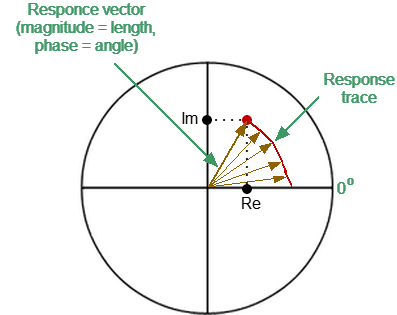
On circular diagrams (Polar and Smith chart), any point of the trace can be defined in the following two ways (See figure below): •Coordinates of the point (Re, Im) on the real and imaginary coordinate axes. •Parameters of the vector directed to the point from the center of the diagram. The length of this vector is equal to the response amplitude, and the angle between the vector and the positive part of the real coordinate axis is equal to the phase of the response. The angle is calculated counterclockwise.
|
The Smith chart is a circular chart on which the measured complex reflection coefficients (S11) are compared with the normalized impedance of the DUT.
The Smith chart is formed from a rectilinear impedance plane by collapsing the area with positive resistance into a single unit circle (See figure below).
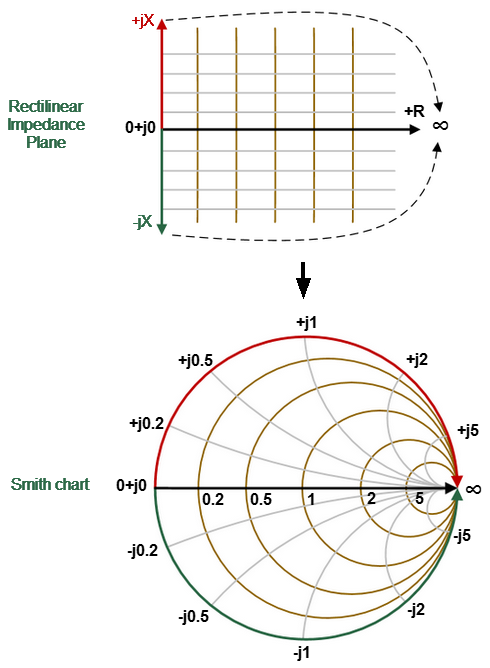
Converting Rectilinear Impedance Plane to Smith Chart
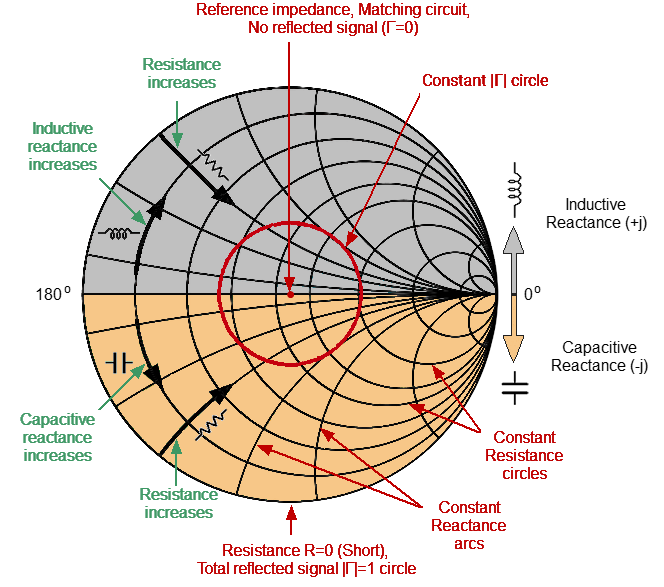
Basic properties of the Smith chart (See figure below):
•Each point on the diagram is equivalent to the complex impedance of the DUT:
,
where — real part of the impedance (resistance), — imaginary part of the impedance (reactance).
•The horizontal axis is resistance; reactance on this axis is equal to zero.
•Grid lines of the diagram consist of circles of constance resistance and arcs of constant reactance.
•The center of the diagram corresponds to the system reference impedance (Z/Z0 = 1).
•At the rightmost point of the horizontal axis, the impedance has an infinitely large value (Open circuited load).
•At the leftmost point of the horizontal axis, the impedance value is zero (Short circuited load).
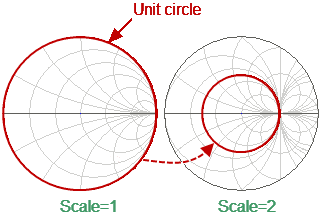
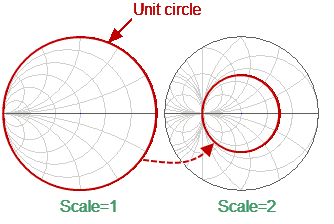
•The outer circle of the diagram at scale = 1 (or unit circle) corresponds to a zero resistance value (reactance only). The measured points inside the unit circle correspond to the passive load, the points outside to the active load.
note |
Location of the unit circle at a scale greater than 1
|
•The upper and lower halves of the diagram correspond to the positive (inductive) and negative (capacitive) reactive components of impedance.
•Reflection coefficient value () at any point of the diagram is determined by the distance from it to the center of the diagram. Thus, any circle with the center coinciding with the center of the diagram contains equal values of the modulus of the reflection coefficient. The center of the diagram corresponds to a matched circuit with no reflect signal ( = 0). The unit circle diagram corresponds to an unmatched circuit with total reflection || = 1.
Use the Smith chart to assess circuit mismatch and determine whether the load is resistive, inductive, capactive, or complex. The Smith chart format is useful for looking for mismatch introduced by parasitic elements connected in series with the DUT.
Smith Chart Properties
Inverse Smith Chart (Complex Admittance)
The Inverse Smith chart is a circular chart on which the measured complex reflection coefficients (S11) are compared with the normalized DUT admittance. Complex admittance is the inverse of complex impedance.
To build an Inverse Smith chart, mirror the Smith chart on the horizontal axis (See figure below).
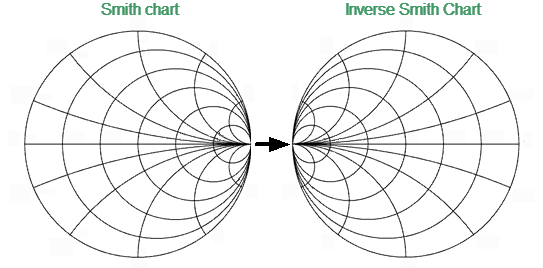
Convert Smith Chart to Inverse Smith Chart
Basic properties of the Inverse Smith chart:
•Each point on the diagram is equivalent to the complex conductance of the DUT:
,
where — real part of conductivity (conductance), — imaginary part of conductivity (susceptance).
•The horizontal axis is only conductance; susceptance on this axis is equal to zero.
•The grid lines of the diagram consist of circles of constant conductance widthand arcs of constant susceptance width.
•The center of the diagram corresponds to the reference conductivity of the system (Y/Y0 = 1).
•At the leftmost point of the horizontal axis, admittance is infinitely large (Short circuited load).
•At the rightmost point of the horizontal axis, admittance is equal to zero (Open circuited load).
•The outer circle at scale = 1 (or unit circle) corresponds to the zero value of conductance (susceptance only). The measured points inside the unit circle correspond to the passive load, the points outside to the active load.
note |
Position of the unit circle at a scale greater than 1
|
•The upper and lower halves of the diagram correspond to the negative (inductive) and positive (capacitive) reactive components (admittance).
•The reflection coefficient display () on the Inverse Smith chart coincides with its display on the Smith chart. The center of the diagram corresponds to a matched circuit with no reflected signal (=0). The unit circle diagram corresonds to an unmatched circuit with total reflection || = 1.
Use the Inverse Smith chart (admittance diagram) to search for a mismatch introduced by the parasitic elements shunting the DUT.
The Smith chart format does not have a frequency axis, so frequency is indicated by markers.
There are five types of Smith chart formats (See table below) corresponding to the data displayed by the marker; the traces remain the same for all the format types.
Format Type Description |
Label |
Data Displayed by Marker |
Measurement Unit |
|---|---|---|---|
Linear Magnitude and Phase |
Smith (Lin) |
S-parameter linear magnitude |
Dimensionless value |
S-parameter phase |
Degree (°) |
||
Logarithmic Magnitude and Phase |
Smith (Log) |
S-parameter logarithmic magnitude |
Decibel (dB) |
S-parameter phase |
Degree (°) |
||
Real and Imaginary Parts |
Smith (Re/Im) |
S-parameter real part |
Dimensionless value |
S-parameter imaginary part |
Dimensionless value |
||
Complex Impedance |
Smith (R + jX) |
Resistance at input:
|
Ohm (Ω) |
Reactance at input:
|
Ohm (Ω) |
||
Equivalent capacitance or inductance:
|
Farad (F) Henry (H) |
||
Complex admittance |
Smith (G + jB) |
Conductance at input:
|
Siemens (S) |
Susceptance at input:
|
Siemens (S) |
||
Equivalent capacitance or inductance:
|
Farad (F) Henry (H) |
||
Z0 — test port impedance. Z0 setting is described in System Impedance Z0. |
|||
The format for each trace of the channel can be selected individually. The trace must be activated before setting the format.
|
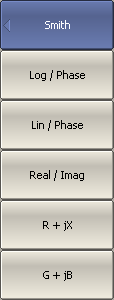
To choose a Smith chart format, use the following softkeys: Response > Format > Smith Then select the desired format: •Log/Phase — Logarithmic magnitude and phase •Lin/Phase — Linear magnitude and phase •Real/Imag — Real and imaginary parts •R+jX — Complex impedance (at input) •G+jB — Complex admittance (at input) |
|
|
note |
The display format can be set using the mouse (See Display Format Setting). |