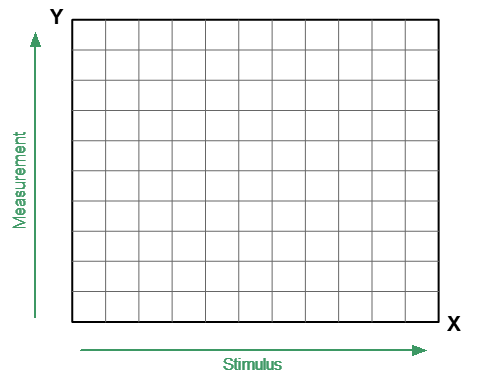
In this format, stimulus values are plotted along X-axis and the measured data are plotted along Y-axis (See figure below).

Rectangular Format
To display complex-valued S-parameters along the scalar Y-axis, it must be transformed into a real number. Rectangular formats involve various types of transformation of an S-parameter
,
where — real part of S-parameter complex value,
— imaginary part of S-parameter complex value.
There are eight types of rectangular formats depending on the measured value plotted along Y-axis (See table below).
Format Type Description |
Label |
Data Type (Y-axis) |
Measurement Unit (Y-axis) |
|---|---|---|---|
Logarithmic Magnitude |
Log Mag |
S-parameter logarithmic magnitude: , |
Decibel (dB) |
Voltage Standing Wave Ratio |
SWR |
|
Dimensionless value |
Phase |
Phase |
S-parameter phase from –180° to +180°:
|
Degree (°) |
Expanded Phase |
Expand Phase |
S-parameter phase, measurement range expanded to from below –180° to over +180° |
Degree (°) |
Group Delay |
Group Delay |
Signal propagation delay within the DUT: ,, |
Second (sec.) |
Linear Magnitude |
Lin Mag |
S-parameter linear magnitude: |
Dimensionless value |
Real Part |
Real |
S-parameter real part: |
Dimensionless value |
Imaginary Part |
Imag |
S-parameter imaginary part: |
Dimensionless value |
The format for each trace of the channel can be selected individually. The trace must be activated before setting the format.
|
To choose a rectangular format, use the following softkey: Response > Format Then select the desired format: •Log Mag — Logarithmic magnitude •SWR — Voltage Standing Wave Ratio •Phase •Expanded Phase •Group delay •Lin Mag — Linear magnitude •Real — Real part •Imag — Imaginary part |
|
|
note |
The display format can be set using the mouse (See Display Format Setting). |
