The following hierarchy of measurement, processing, and display tools is used during operation of the Analyzer (See figure below):
•Analyzer Hardware makes radio frequency measurements of the DUT parameters and performs primary processing of measurement results.
•Analyzer Software (supplied with the Analyzer) controls the operation of the Analyzer components and performs the final mathematical processing and display of the measurement results.
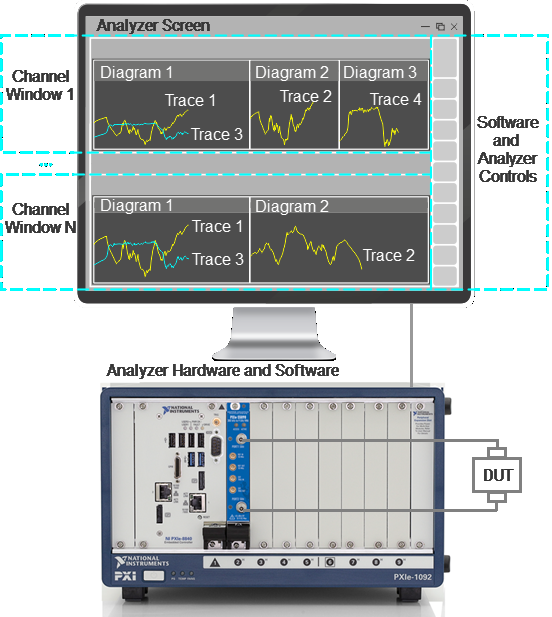
Hierarchy of measuring, processing, and displaying tools
Analyzer Software is displayed as Analyzer Screen on the control PC screen, which contains the following:
•Channel Windows – the diagram area in which the Channel is displayed. For a detailed description of the controls, see Channel Window Layout and Functions.
•Software and Analyzer Controls: menu bar, instrument status bar, and softkey bar. For a detailed description of the controls, see Screen Layout and Functions.
Channel – a logical analyzer created by the software to perform DUT measurements with set parameters. The software supports up to 16 channels simultaneously, processing them one at a time. Thus, the same DUT can be sequentially measured by 16 logic analyzers with individual settings.
The channel settings are:
•Calibration and Calibration Kits
The measurement results of the DUT in the channel are displayed in traces.
Trace – a sequence of data points measured (data trace) or memorized (memory trace) by the analyzer, connected by a line. Each channel contains up to 16 Traces. The trace is characterized by the following parameters:
The following functions apply to the trace:
Each channel window can display up to 16 charts simultaneously. Convenient placement of traces in the channel window is designated as Diagram. Traces can be placed in a single chart or grouped according to user settings in different charts. For a detailed description of working with diagrams, see Trace Allocation.